Macroscopic and Microscopic pKa
by Corin Wagen · Aug 11, 2025

"Analogy of the Microcosm and Macrocosm of Alchemy" from Opus Medico-Chymicum, Johann Daniel Mylius (1618)
If you've taken a general or organic chemistry class, you've almost certainly run into the concept of pKa: the negative logarithm of the acid dissociation constant, Ka. The pKa of a molecule is a way to quantify how acidic or basic it is, which in turn can be used to predict its stability, reactivity, and ionization state in a variety of downstream environments.
For simple monoprotic acids and bases, a single pKa value is all you need to fully characterize a molecule's response to changing pH. But almost all complex molecules—like amino acids, nucleotides, peptides, polycarboxylic acids—and drugs, have multiple ionizable sites. This is where the distinction between macroscopic and microscopic pKa values becomes crucial.
In this post, we'll explore the difference between these two pKa-prediction paradigms, when they break down, and when to use each method.
Definitions
The "textbook" acid–base equilibrium for a monoprotic acid HA is:
The equilibrium constant is:
and
In this situation, there's only one proton that can be lost, so the pKa you measure is unambiguous. Each of the above species, HA and A-, is a "microstate" which corresponds to a given arrangement of protons on the molecule. A molecule with one ionizable site has two protonation microstates, a molecule with two ionizable sites has four protonation microstates, and more generally a molecule with ionizable sites has protonation microstates.
For molecules with more than one microstate, different forms of pKa become possible:
- Macroscopic pKa values connect two protonation states that differ by one total proton. Each protonation state is an ensemble of microstates (different tautomers and conformers with the same total charge).
- Microscopic pKa connects two specific microstates that differ by moving a named proton at a named site, holding the rest of the bonding pattern fixed. Microscopic constants depend on which other sites are protonated because the local environment shifts.
The two definitions coincide only for a monoprotic solute with a single dominant tautomer at each charge.
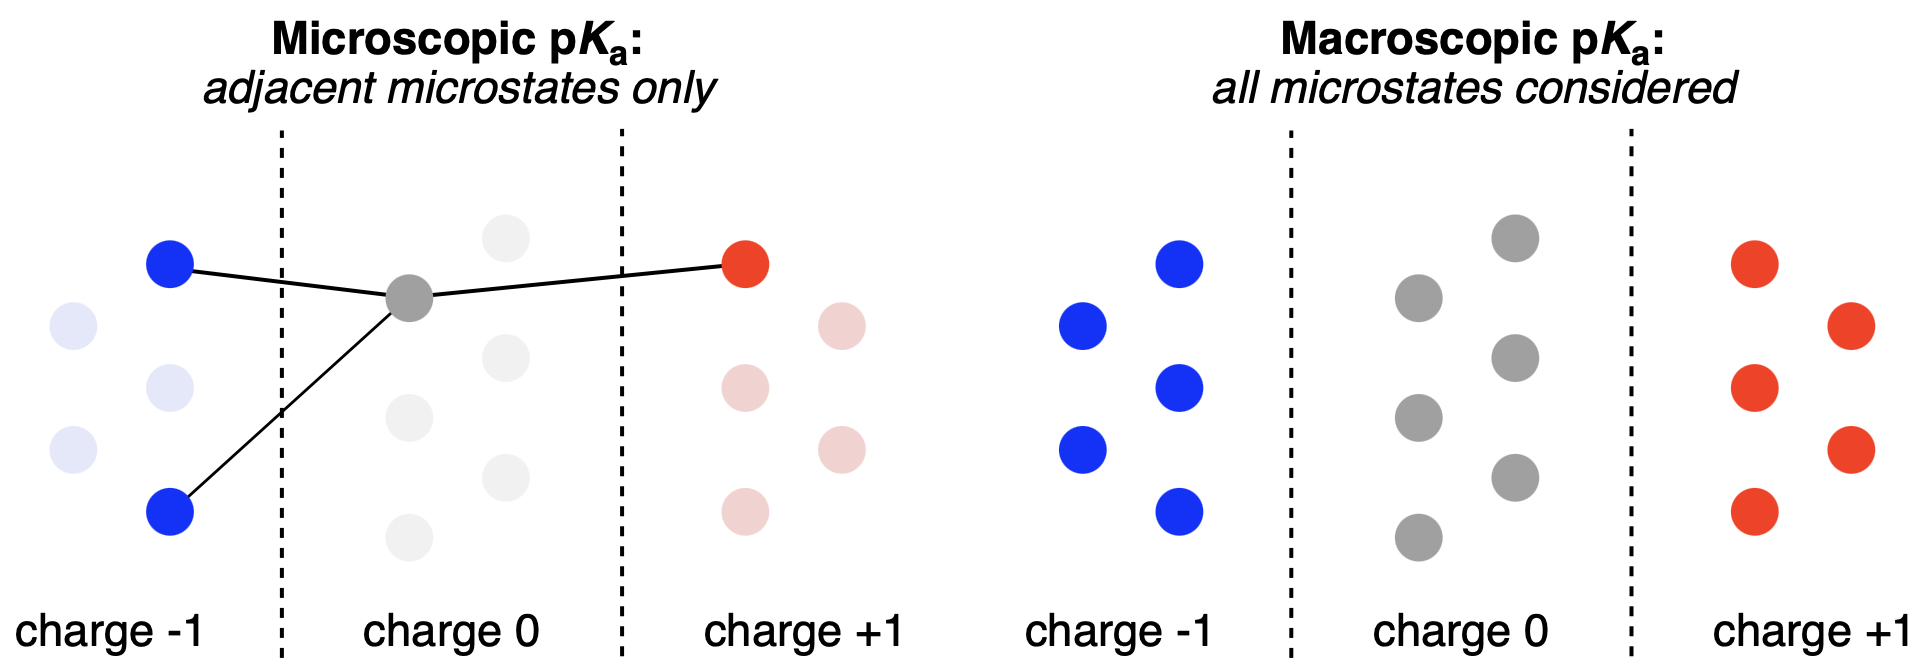
Macroscopic and microscopic pKa prediction strategies compared. Individual circles represent microstates. Figure from our macroscopic pKa work.
Almost all experimental pKa measurement techniques—like NMR spectroscopy, potentiometric or colorimetric titration, and UV-Vis-spectroscopy-based methods—measure macroscopic pKa values. This is because these measurements are bulk measurements, averaged over all molecules in solution, and thus record the average protonation state of the molecule and not the specific location of protonation or deprotonation. Measuring microscopic pKa values experimentally is possible but typically requires unique and well-resolved signals for individual microstates.
Case Study: Glycine
Glycine, the simplest amino acid, has two ionizable sites: a carboxylic acid and an amine. This gives rise to four microstates across three charge states (+1, 0, and -1). There are four microscopic pKa values for glycine:
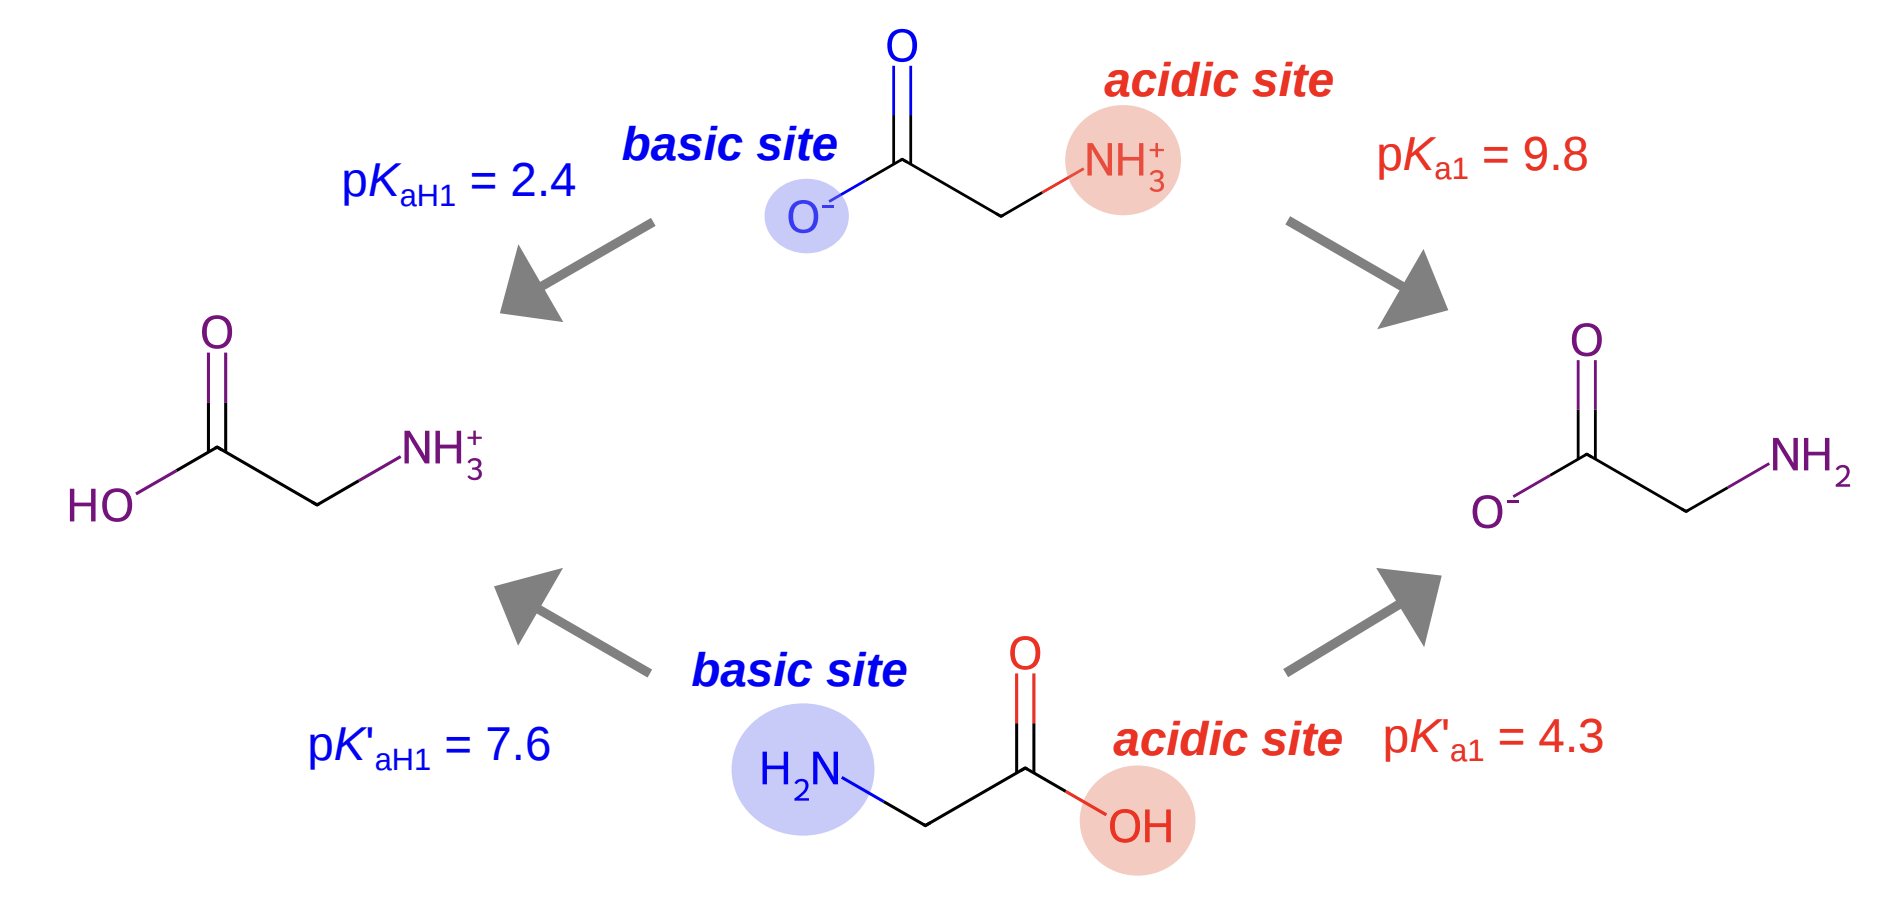
Microscopic pKa values for glycine; figure from Zheng et al (2024).
These microstates can be combined into three protonation states:
- Fully protonated: H2A+ (left microstate above)
- One proton lost: HA(1) and HA(2) (center microstates above)
- Two protons lost: A- (right microstate above)
The two macroscopic equilibria, which can be measured experimentally, are:
Notice that the "HA" species in the middle is actually a mixture of two different microstates: one with the acid group deprotonated, and one with the amino group deprotonated. The macroscopic pKa value treats them as a single "bucket" containing all species with the same net charge.
In this case, the zwitterionic neutral microstate dominates and so the microscopic pKa values corresponding to proton gain/loss from the zwitterionic microstate become the observed macroscopic pKa values. Trying to predict the experimental pKa values from the neutral (canonical) microstate, in contrast, is a fool's errand—the microscopic pKa values will not only be quantitively wrong (4.3 and 7.6, not 2.4 and 9.8) but also qualitatively incorrect, since the location of the "acidic" and "basic" sites will be backwards.
Case Study: Piperidine
Things become more complex when a molecule doesn't have a single dominant microstate. Piperazine is a symmetric diamine with experimental macroscopic pKa values of 5.35 and 9.37 (ref). But starting from the neutral microstate, a microscopic pKa calculation predicts identical pKa values of approximately 9 for the two amines:
This makes a certain amount of sense: protonation of either amine generates the same symmetric monoprotonated structure. But this calculation does not match the experimental data at all, because it never even considers the diprotonated microstates (which is two seperate protonation steps away from the starting structure). Only by running a second calculation from the output monoprotonated structure can we find a pKa value that's even close to the experimental value of 5.35:
In contrast, a macroscopic pKa calculation automatically takes into account all microstates and predicts values of 5.64 and 9.46, in good qualitative agreement with experimental values:
In this case, it's clear that macroscopic pKa prediction is necessary for sane results.
When To Use Each Method
To summarize, macroscopic and microscopic pKa calculations are answering different questions:
- Macroscopic pKa: "At what pH are all molecules in solution evenly split between two charge states?"
- Microscopic pKa: "At what pH does this site lose its proton, given the current protonation state of the rest of the molecule?"
If you want to compare computed pKa values to experimental measurements, you should almost always be using macroscopic pKa values—for all but the simplest cases, these are significantly more physically accurate and reliable. Particularly for large druglike molecules with dozens or hundreds of potential microstates, it's almost impossible to get meaningful agreement with experimental data when using microscopic pKa calculations.
However, macroscopic pKa calculations have their downsides. The predicted pKa values can no longer be assigned to a single functional group, making them less interpretable and chemically intuitive. For many use cases—like tracking the protonation of specific moieties or residues—microscopic pKa values may be more useful. Macroscopic pKa calculations are also more complex and frequently more costly to run, since the number of microstates grows exponentially with the number of ionizable sites. (We've spent a considerable amount of time and energy optimizing our implementation of macroscopic pKa here at Rowan—smart beam-search-based microstate pruning, ML-based scoring functions, and so on—and it's still quite slow for large molecules.)
Regardless of which paradigm is better for your scientific question, knowing the difference between macroscopic and microscopic pKa is crucial.
Further Reading
- This paper from Jonathan Zheng and co-workers illustrates how failing to properly disambiguate microscopic and macroscopic pKa values can lead to bizarre and unphysical predictions.
- This paper from George Bodner illustrates the mathematics behind complex polyprotic pKa equilibria in more detail.
- This paper on the SAMPL6 challenge compares the performance of a variety of macroscopic and microscopic pKa-prediction methods on real-world data.