Running Geometric Scans
Running scans along certain geometric coordinates is an important way to learn about the potential-energy surface of a molecule or system.
Model Perturbations, Torsional Barriers, and Changes in Bonding
In a scan, a user selects a specific geometric coordinate (a bond distance, angle, or dihedral angle) and specifies a list of values for that coordinate. The software program running the scan then generates structures matching each value and optimizes each structure while freezing the scan coordinate. The final result is a graph showing how the energy of the system changes as a function of the scan coordinate. This workflow can be used to show how a given geometric perturbation affects the energy of a molecule; scans around dihedral angles can be used to model torsional barriers to rotation, while distance scans can be used to model bond-breaking or bond-forming processes, or even complexation/decomplexation events in supramolecular complexes.
Running Scans in Rowan
Many scans are done with only a single optimization per point, which generates inaccurate results for complex molecules where there can exist multiple conformational minima per value of the scan coordinate. Rowan instead employs the recent "wavefront propagation" algorithm for scans, which repeatedly re-initializes each scan point from its neighbors until the entire surface is stable, thus eliminating the bizarre memory effects that plague many torsional scans. Without this approach, barriers to torsional scans are often overestimated, which can lead to erroneous prediction of isomeric stability!
Rowan's scan workflow streams updates to the web in real time, making it easy to monitor, analyze, and resubmit from scans as they run. Our web interface allows users to quickly visualize each scan step, and individual optimizations can be inspected as needed. Rowan's interface also allows for comparison of orthogonal degrees of freedom: simply select an additional geometric coordinate in the molecule viewer and Rowan will automatically plot how this variable changes on the scan graph. All scan data can also be downloaded as a .csv file.
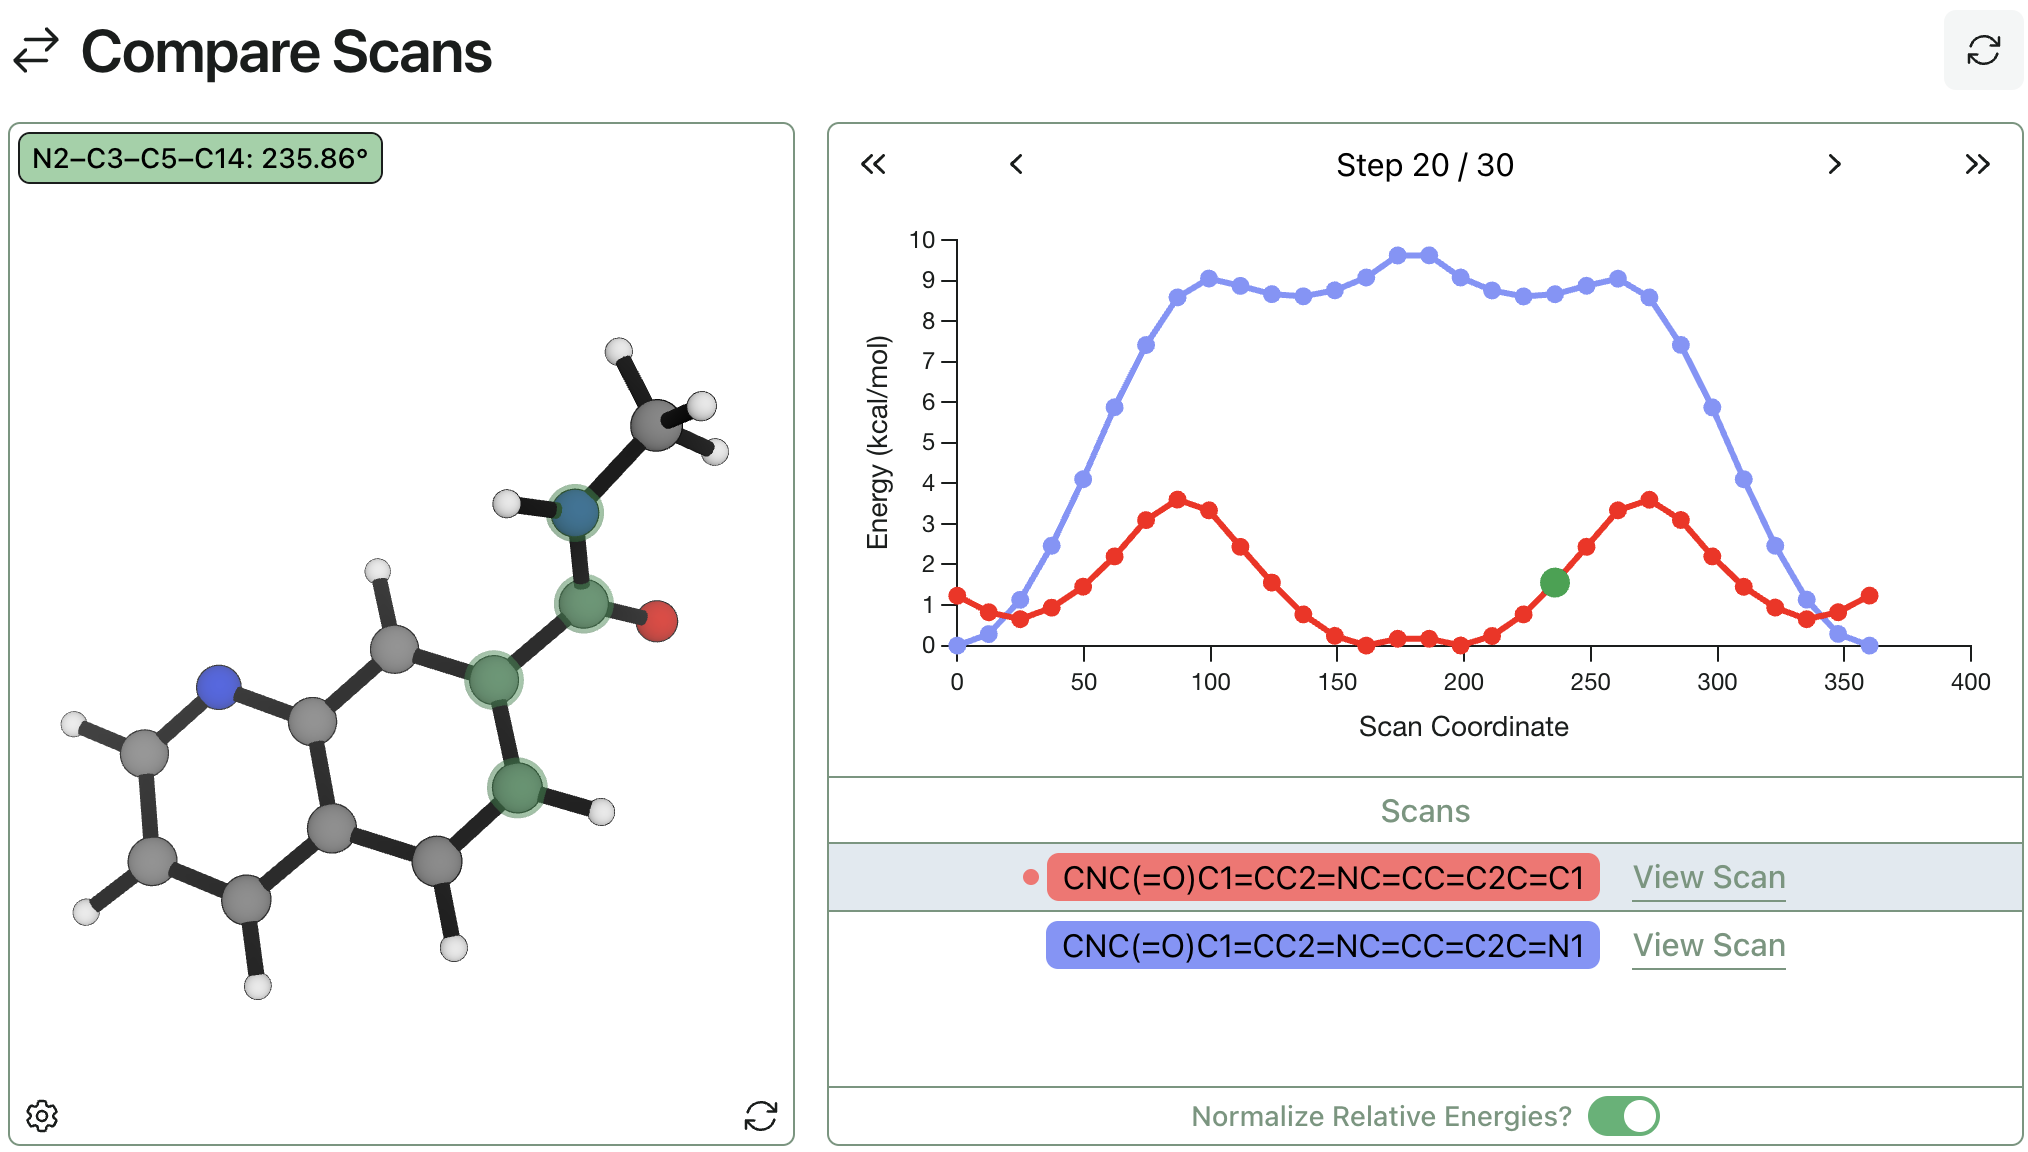
Comparing Multiple Scans
Rowan makes it easy to compare multiple scans and generate publication-quality data as your jobs run. Simply select two or more scans to superimpose their graphs on the same coordinate axis—here's two torsional scans being compared. This convenient tool makes it faster and easier to compare torsional profiles and understand how chemical perturbations affect the conformational behavior of your molecules.