Predicting UV-Vis Spectra with TDDFT
by Isaiah Sippel · August 25, 2026
Note from Ari: this post is the result of a project completed during Isaiah's summer internship. Isaiah helped us find a lot of rough edges in our initial TDDFT implementation, and we're excited to be releasing this modeling work as we move TDDFT to public general access. Thanks, Isaiah!
Designing new dyes, colorants, pigments, and translucent materials is traditionally a guess-and-check process involving costly experiments. With predictive tooling, chemists can find better compounds by only making compounds with good in silico properties before making them in real life.
In this study, we explore using time-dependent density-functional theory (TDDFT) to predict UV-Vis spectra. Specifically, we look at the wavelength of a sample's peak absorbance (λmax). Although TDDFT isn't naïvely a perfect predictor of UV-Vis spectra, we show that it recreates meaningful rankings and captures trends across classes of compounds, enabling its use in prospective contexts.
Experimental Data
For this work, our reference data comes from the PhotochemCAD Common Compounds Spectra database, reported in Taniguchi and Lindsey 2017.
For preliminary testing, a subset of 19 azo dyes was used:
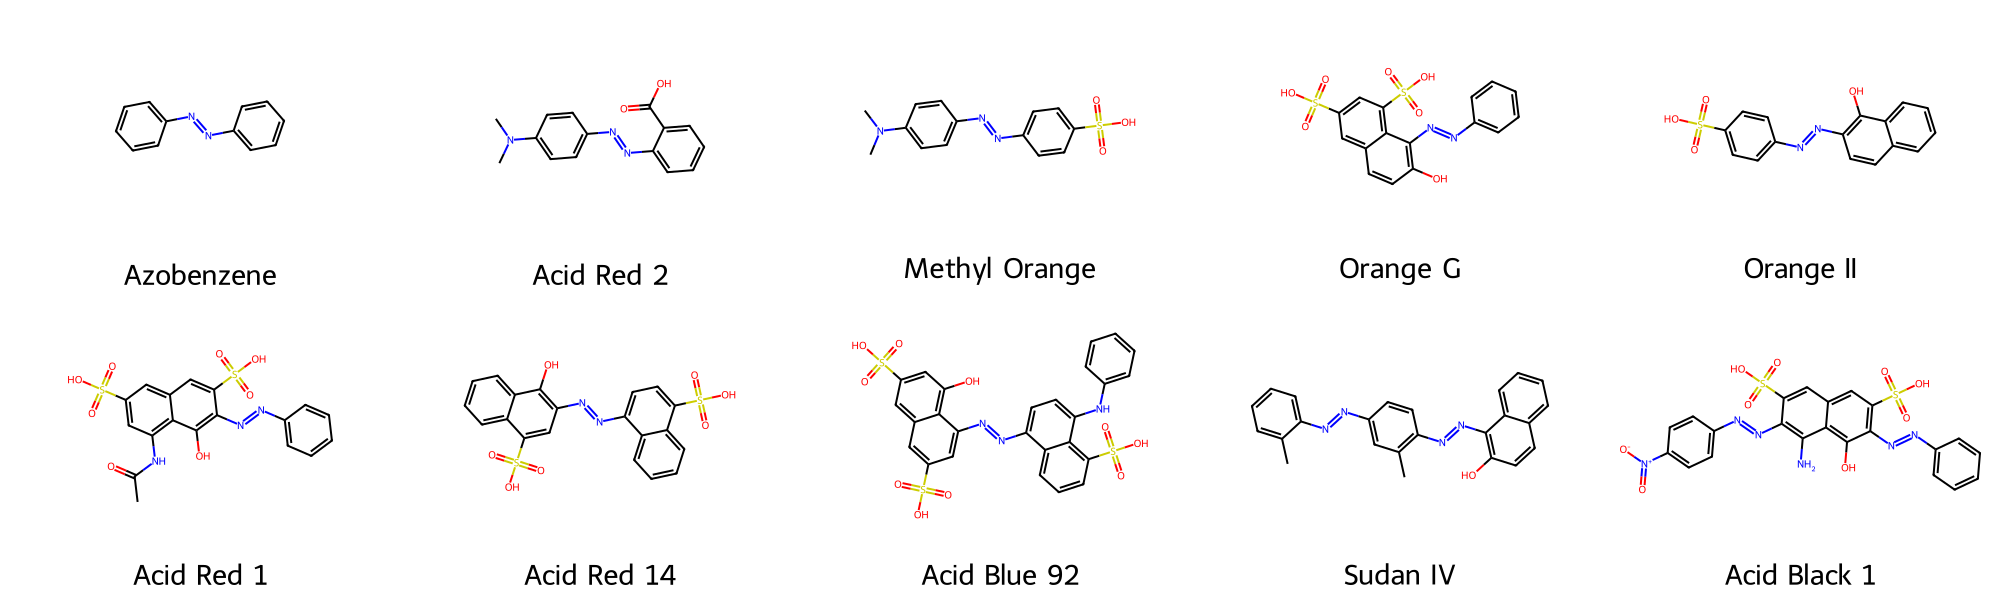
All 19 azo dyes used can be found in Appendix A.
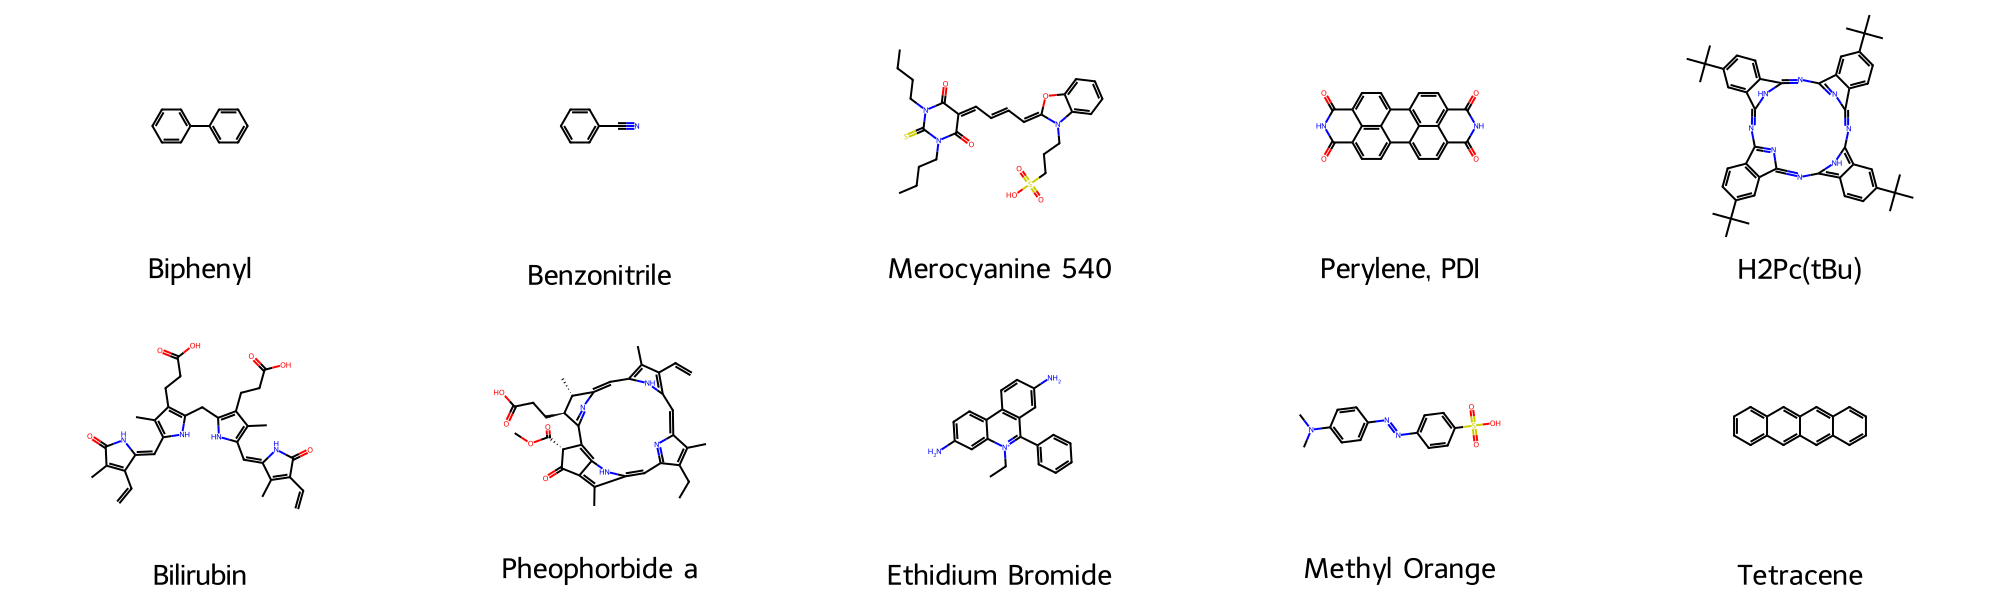
For subsequent testing, we sampled 100 random compounds from the PhotochemCAD database, excluding metal complexes and compounds that were measured in non-neutral solutions. These spanned the chemical classes listed in Appendix B.
HOMO–LUMO Gaps as a TDDFT Surrogate
HOMO–LUMO gaps are sometimes used as a simple predictor of λmax. To evaluate this approach, we ran the following calculations on each of our 19 azo dyes:
- Tautomer search using openconf for conformer searching and AIMNet2 for refinement
- B97-3c single-point calculation on the lowest-energy tautomer to obtain the HOMO–LUMO gap
Tautomer searches failed for Ponceau S and Evans Blue, leaving 17 dyes for comparison.
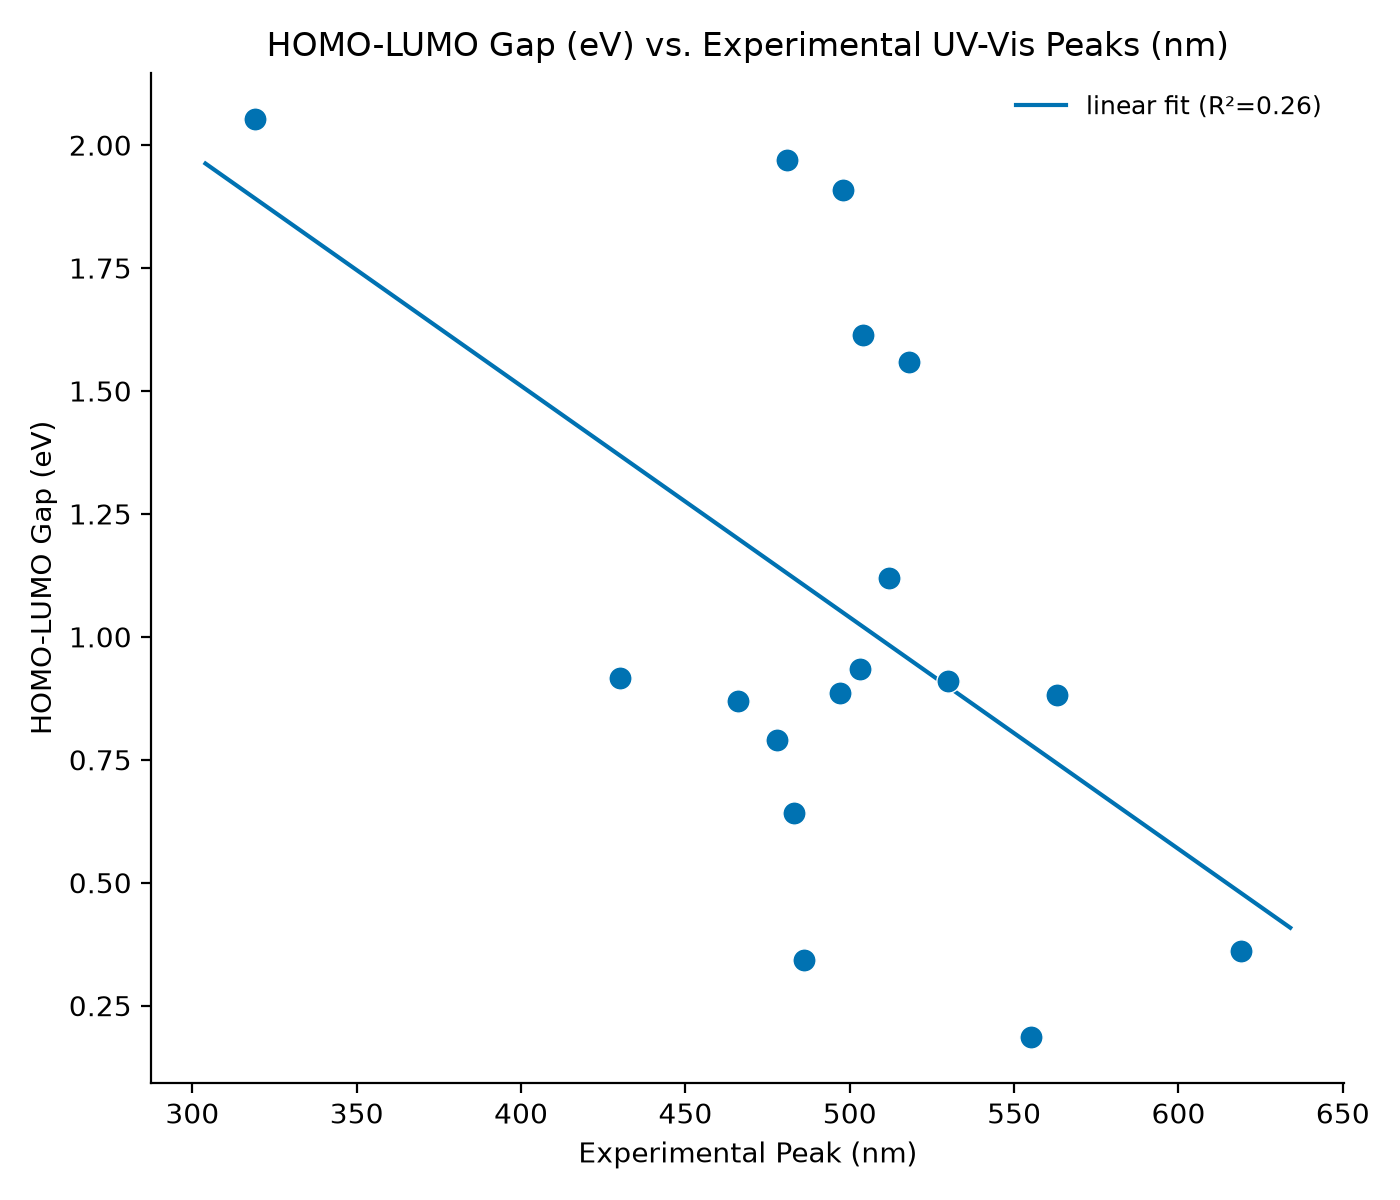
| n | Pearson R | R2 | Spearman ρ |
|---|---|---|---|
| 17 | 0.506 | 0.256 | 0.255 |
HOMO–LUMO gaps show a modest linear association with experimental λmax (R2=0.26) but weak rank-order agreement (Spearman ρ=−0.25), indicating limited value as a ranking surrogate.
A Note About Protonation States
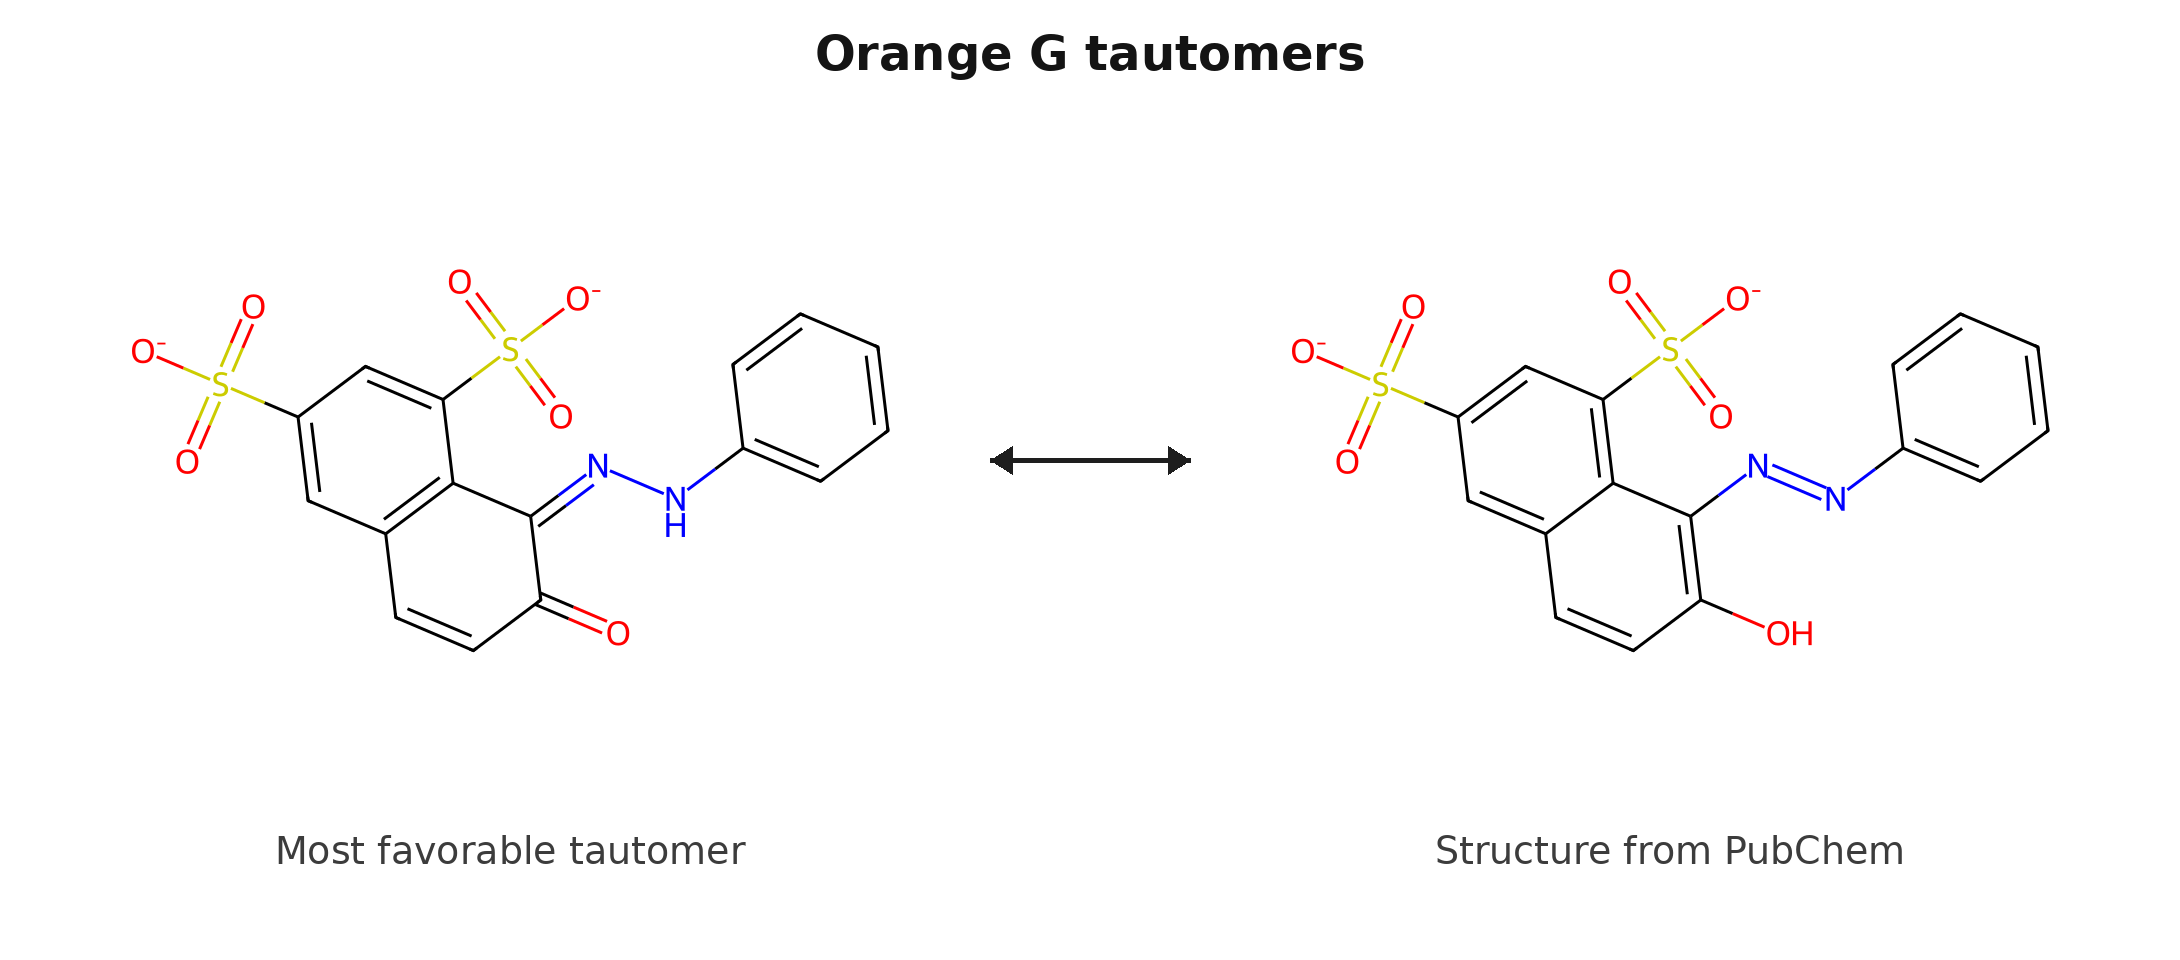
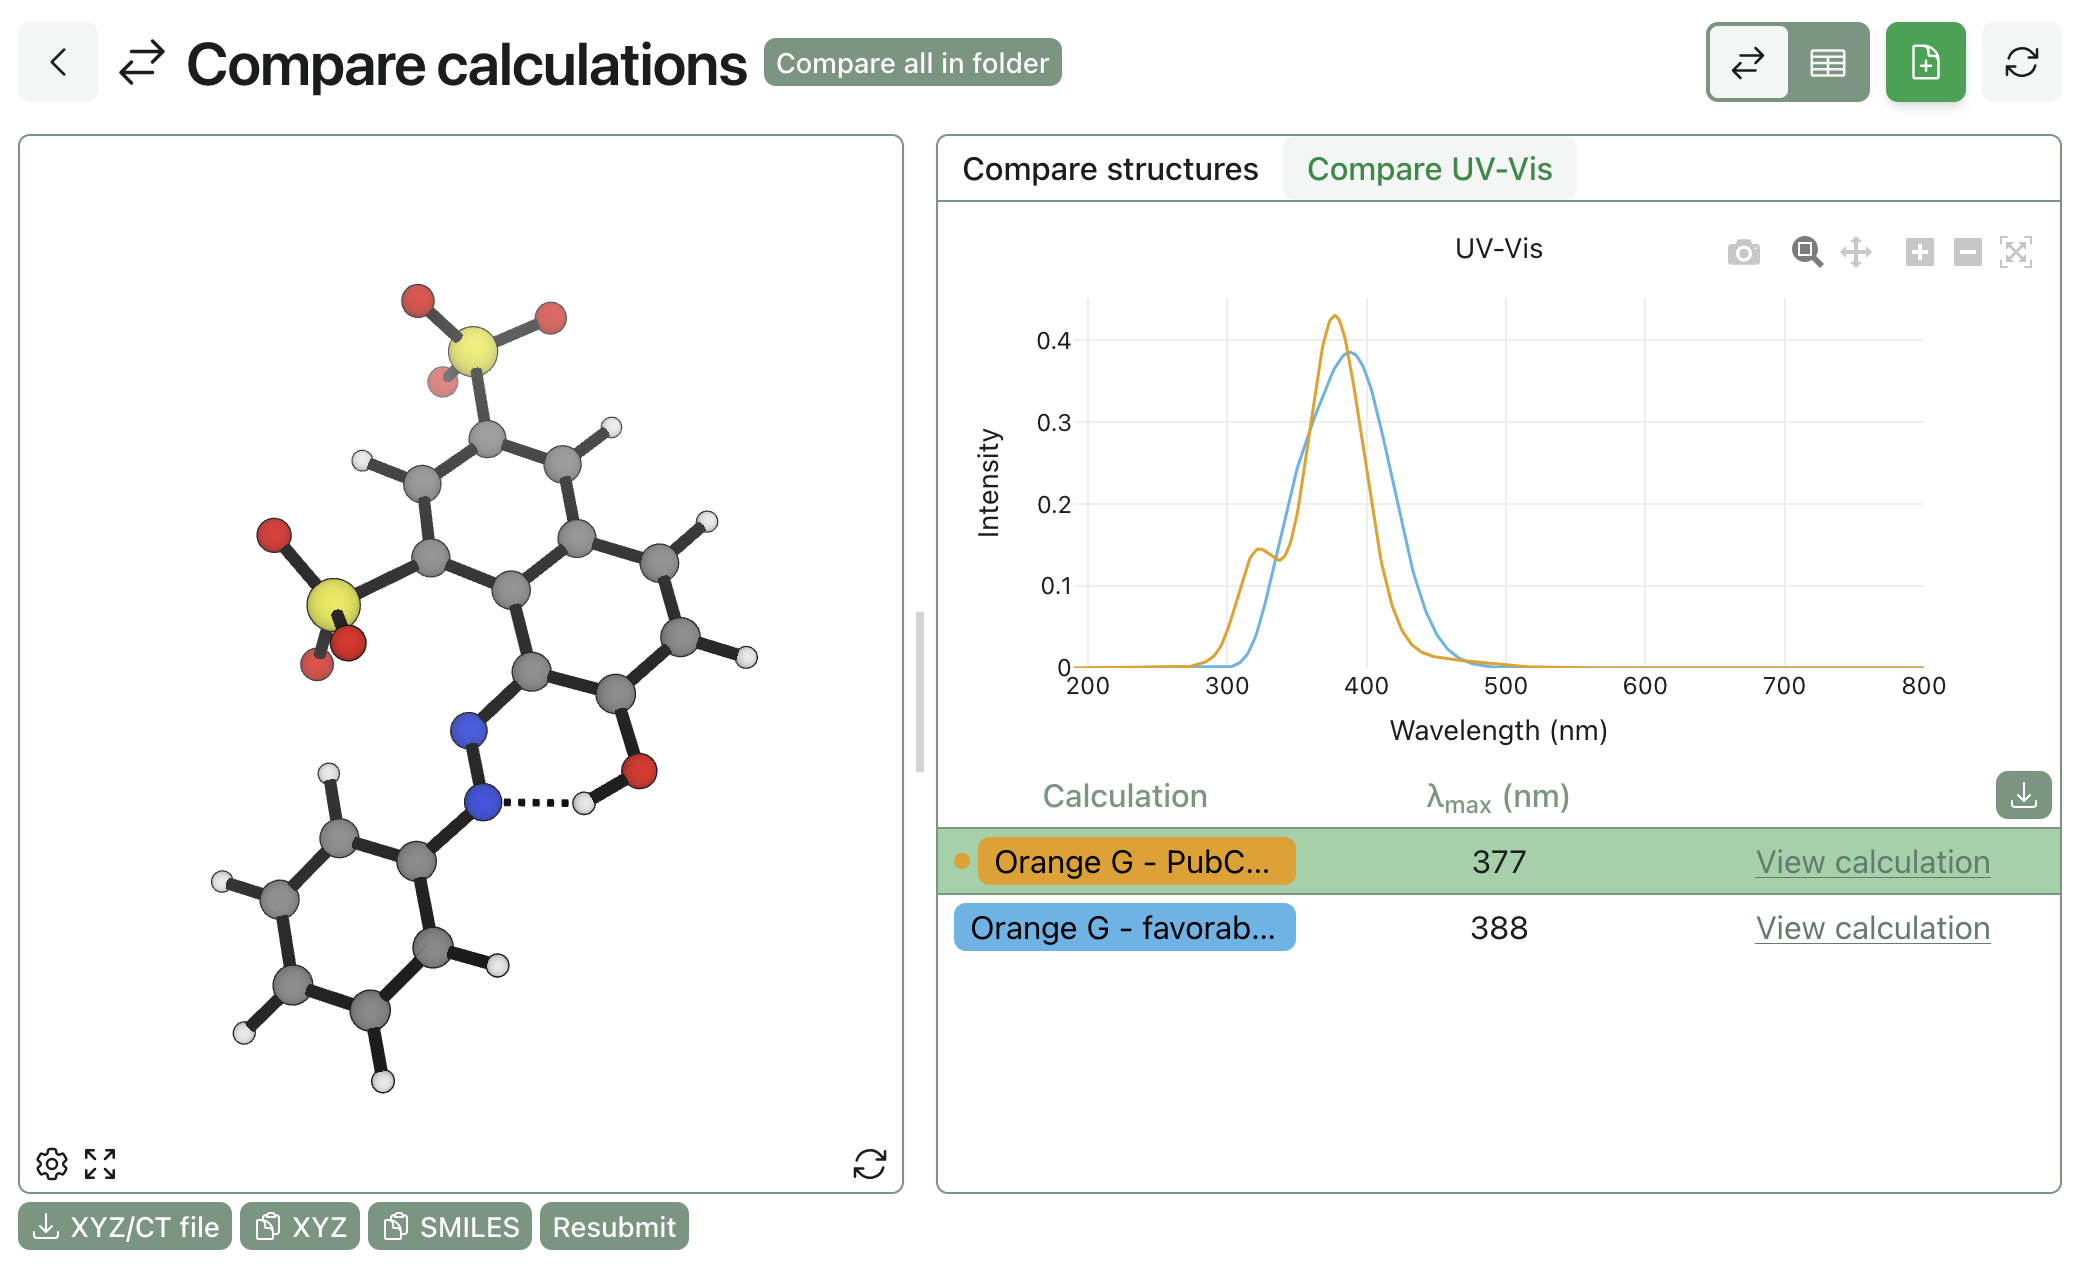
When using TDDFT to predict UV-Vis spectra, it's important to make sure you're modeling the appropriate structures. The first thing to check is protonation state; this can explored with macroscopic pKa calculations or, if a compound's charge state is already known, tautomer searches. The absorption of some dyes is heavily dependent on their tautomerism, e.g. Orange G:
Choosing a Functional
We began our exploration of time-dependent density-functional theory (TDDFT) by testing a range of functionals and basis sets on our set of azo dyes. We performed these calculations both in solvent and in the gas phase to determine which methods could best reproduce experimental trends in λmax.
For this testing and all subsequent work, we ran the following calculations on each dye:
- Tautomer search using openconf for conformer searching and AIMNet2 for refinement
- Further optimization of lowest energy tautomer with first UMA Small 1.2 (OMol) and then ωB97X-d3/def2-SVP
- TDDFT single-point calculation with selected level of theory to predict UV-Vis spectra
The tautomer search and the solvent TDDFT single-points were run in the solvent listed as the solvent of measurement in the PhotochemCAD database for each dye.
Note from the editor: we think that the second step here is overkill. Rowan's tautomer search can be configured to use an desired level of theory for refinement, and we think that UMA Small 1.2 is sufficient for obtaining reasonable geometries of small dye molecules.
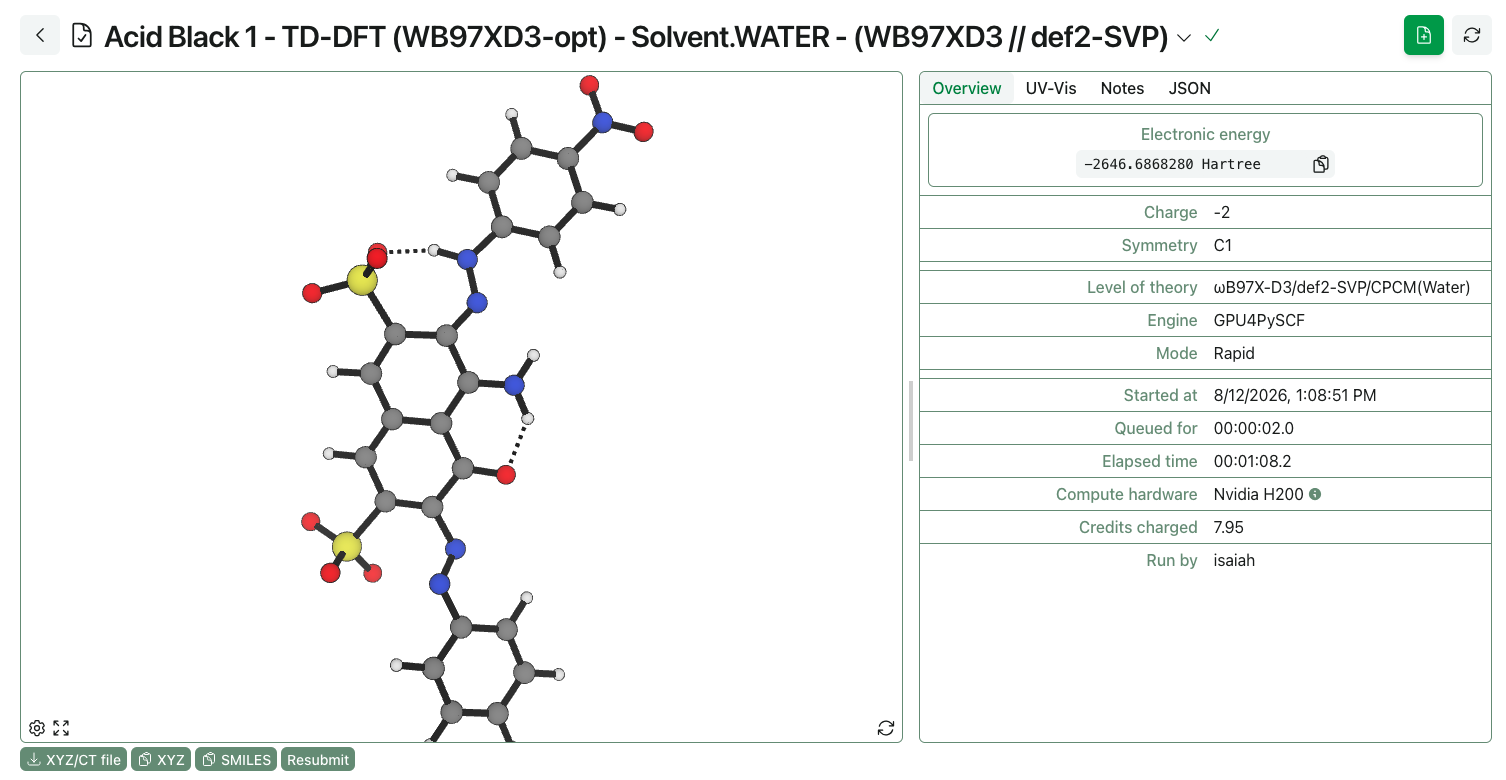
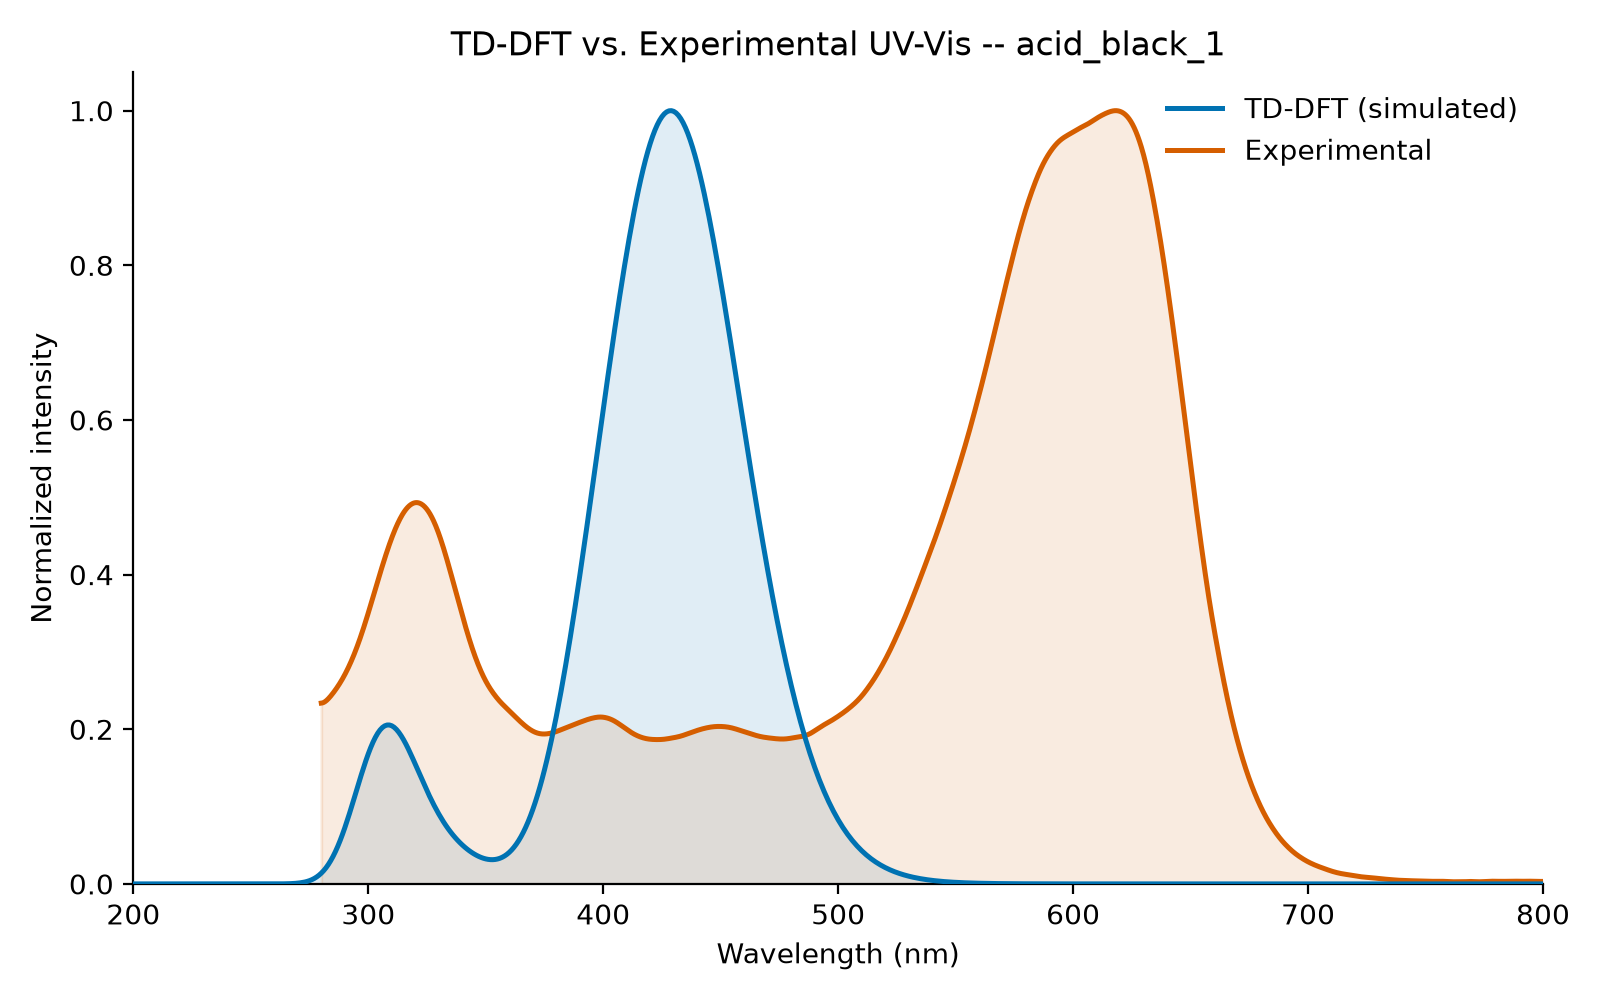
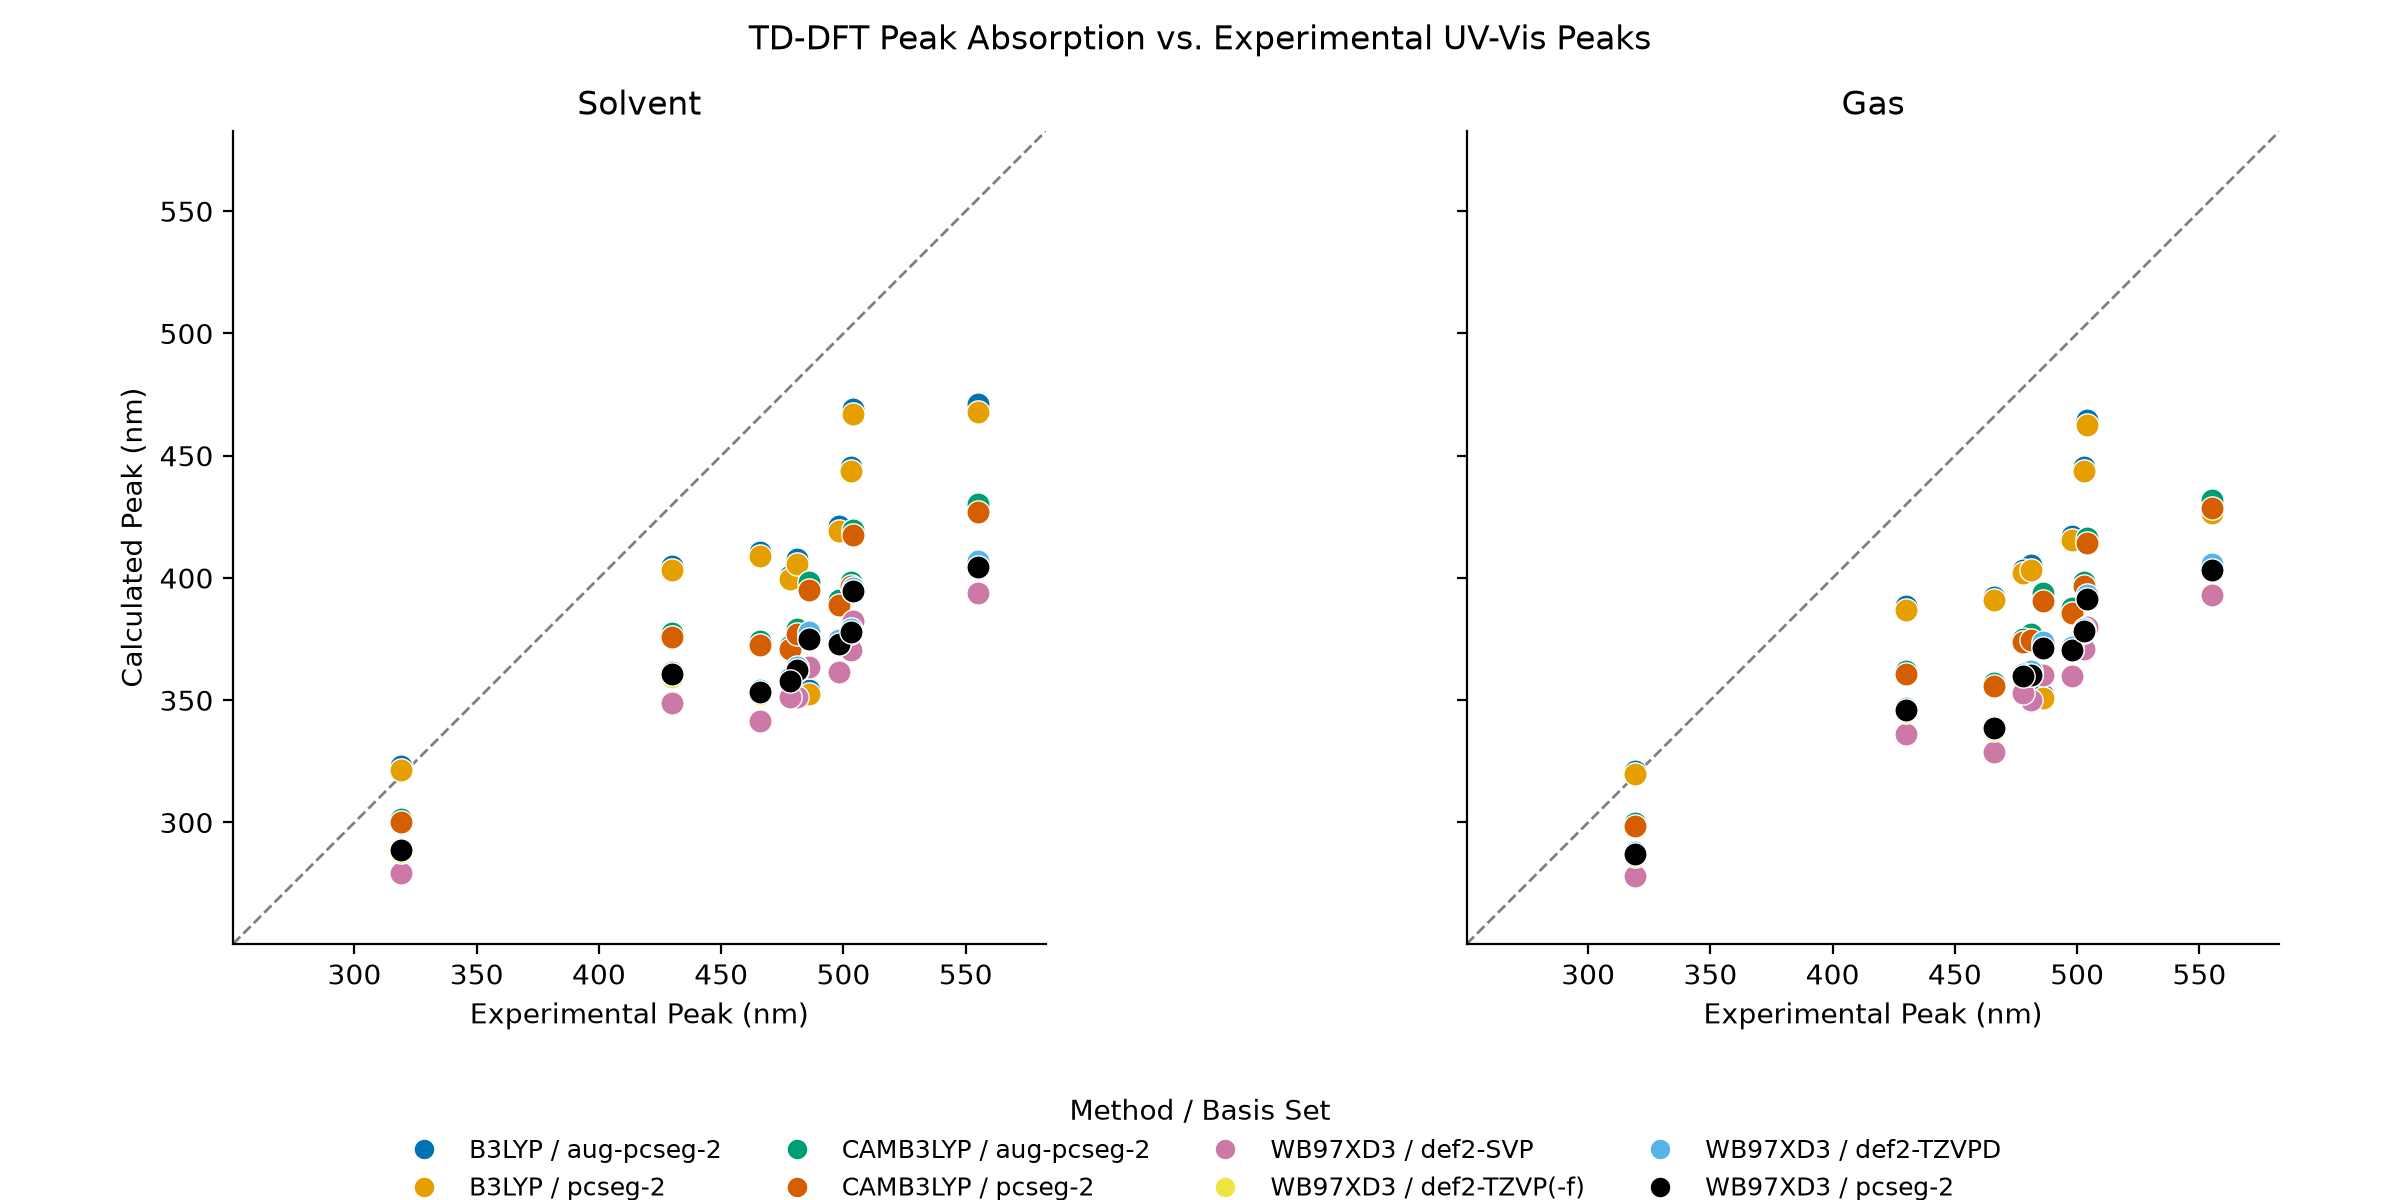
Running this pipeline on a 10 compound subset of our azo dyes with different TDDFT levels of theory gave the following results:
| Level of theory | Phase | n | R² | Spearman ρ | MAE | RMSE |
|---|---|---|---|---|---|---|
| B3LYP/pcseg-2 | gas | 10 | 0.59 | 0.84 | 71.91 | 81.30 |
| B3LYP/pcseg-2 | solvent | 10 | 0.65 | 0.82 | 63.51 | 72.24 |
| B3LYP/aug-pcseg-2 | gas | 10 | 0.59 | 0.84 | 70.67 | 79.97 |
| B3LYP/aug-pcseg-2 | solvent | 10 | 0.65 | 0.82 | 61.98 | 70.61 |
| CAMB3LYP/pcseg-2 | gas | 10 | 0.92 | 0.98 | 93.99 | 98.20 |
| CAMB3LYP/pcseg-2 | solvent | 10 | 0.90 | 0.94 | 89.74 | 94.59 |
| CAMB3LYP/aug-pcseg-2 | gas | 10 | 0.91 | 0.98 | 92.08 | 96.29 |
| CAMB3LYP/aug-pcseg-2 | solvent | 10 | 0.90 | 0.94 | 87.77 | 92.63 |
| ωB97X-D3/def2-SVP | gas | 10 | 0.93 | 0.96 | 121.01 | 124.93 |
| ωB97X-D3/def2-SVP | solvent | 10 | 0.93 | 0.98 | 117.62 | 121.87 |
| ωB97X-D3/def2-TZVP(-f) | gas | 10 | 0.92 | 0.98 | 111.35 | 115.46 |
| ωB97X-D3/def2-TZVP(-f) | solvent | 10 | 0.92 | 0.95 | 107.38 | 111.93 |
| ωB97X-D3/def2-TZVPD | gas | 10 | 0.92 | 0.98 | 109.98 | 114.14 |
| ωB97X-D3/def2-TZVPD | solvent | 10 | 0.92 | 0.95 | 105.78 | 110.38 |
| ωB97X-D3/pcseg-2 | gas | 10 | 0.93 | 0.98 | 111.34 | 115.57 |
| ωB97X-D3/pcseg-2 | solvent | 10 | 0.92 | 0.95 | 107.16 | 111.82 |
All of these functionals struggled to predict absolute λmax values, but they all captured some relative trend between dyes. The biggest jump in ranking accuracy seems to come from using a range-separated hybrid (CAMB3LYP or ωB97X-D3/pcseg-2) instead of a pure hybrid (B3LYP).
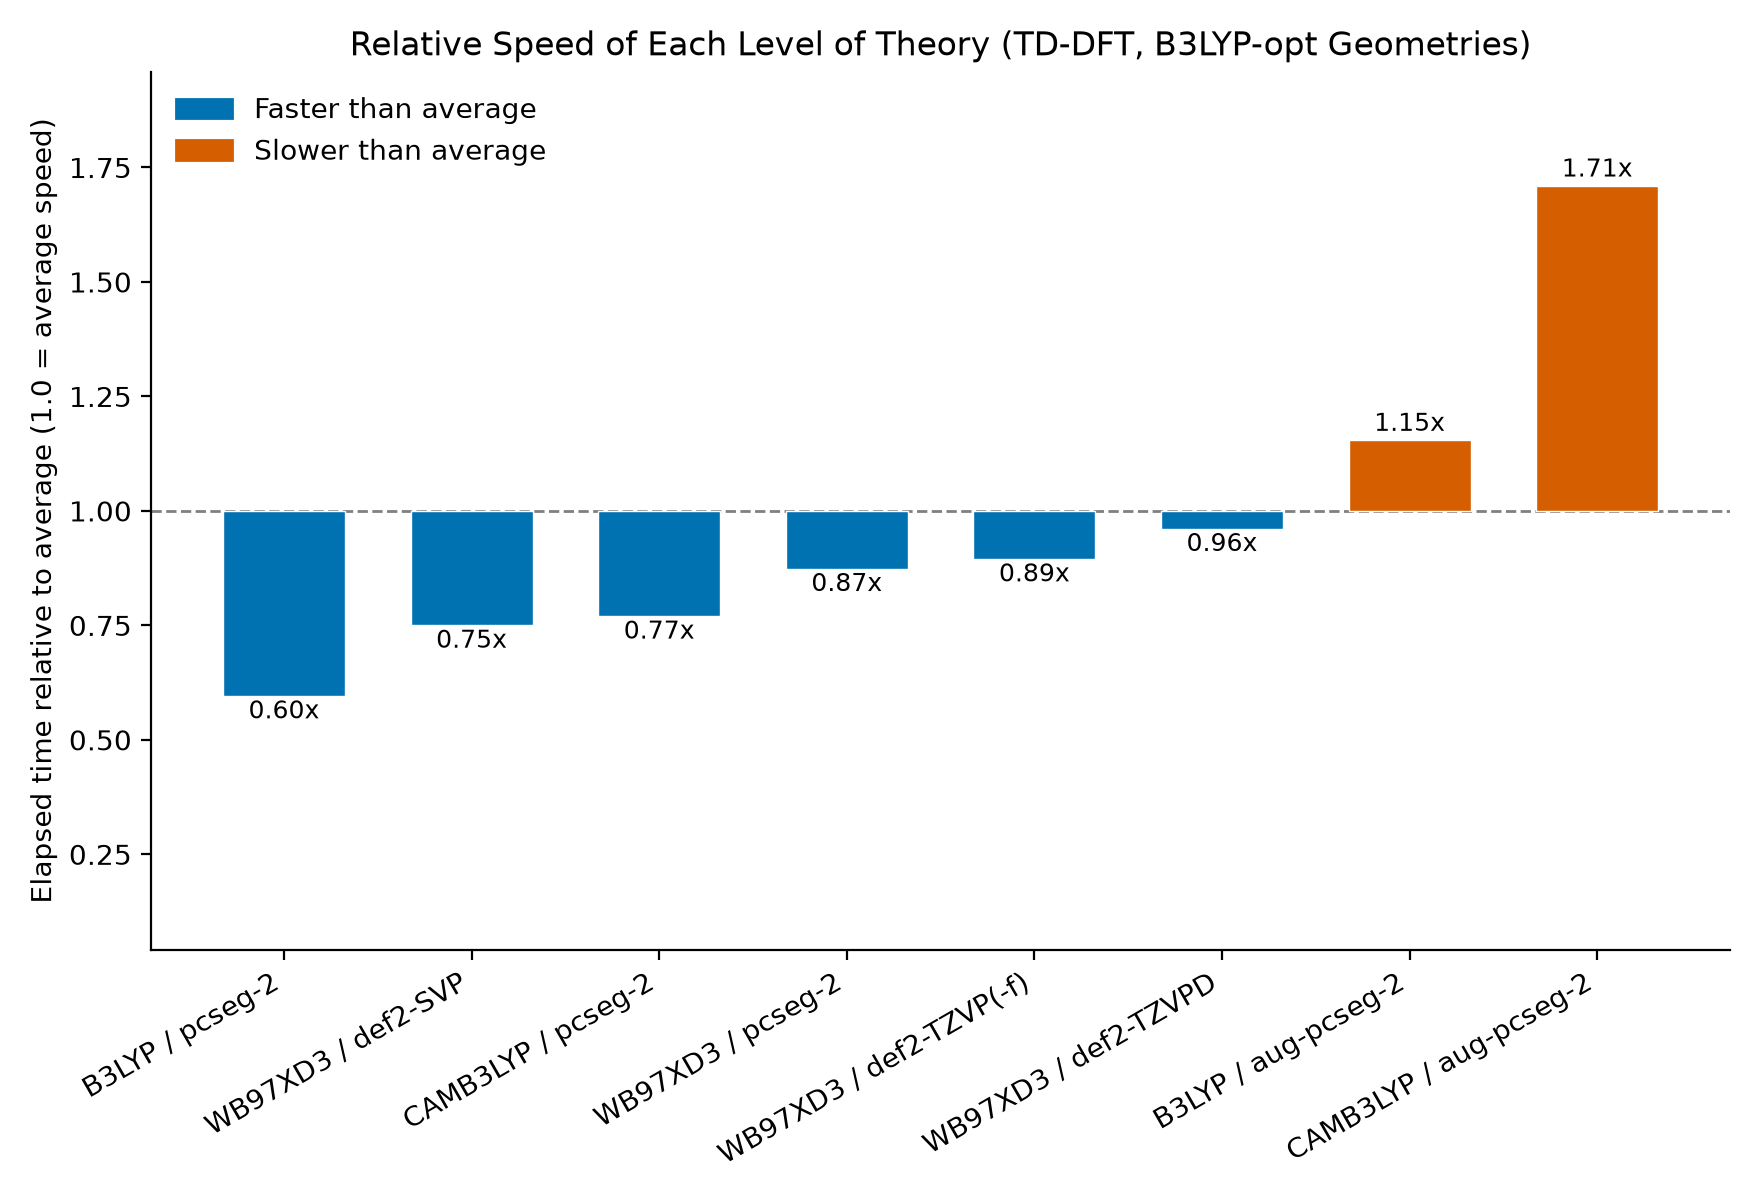
Consistent with standard intuition, using range-separated hybrid functionals and increasing the basis set size increased the compute time, though not prohibitively so (thanks to their efficient implementation in GPU4PySCF).
Choosing a Basis Set
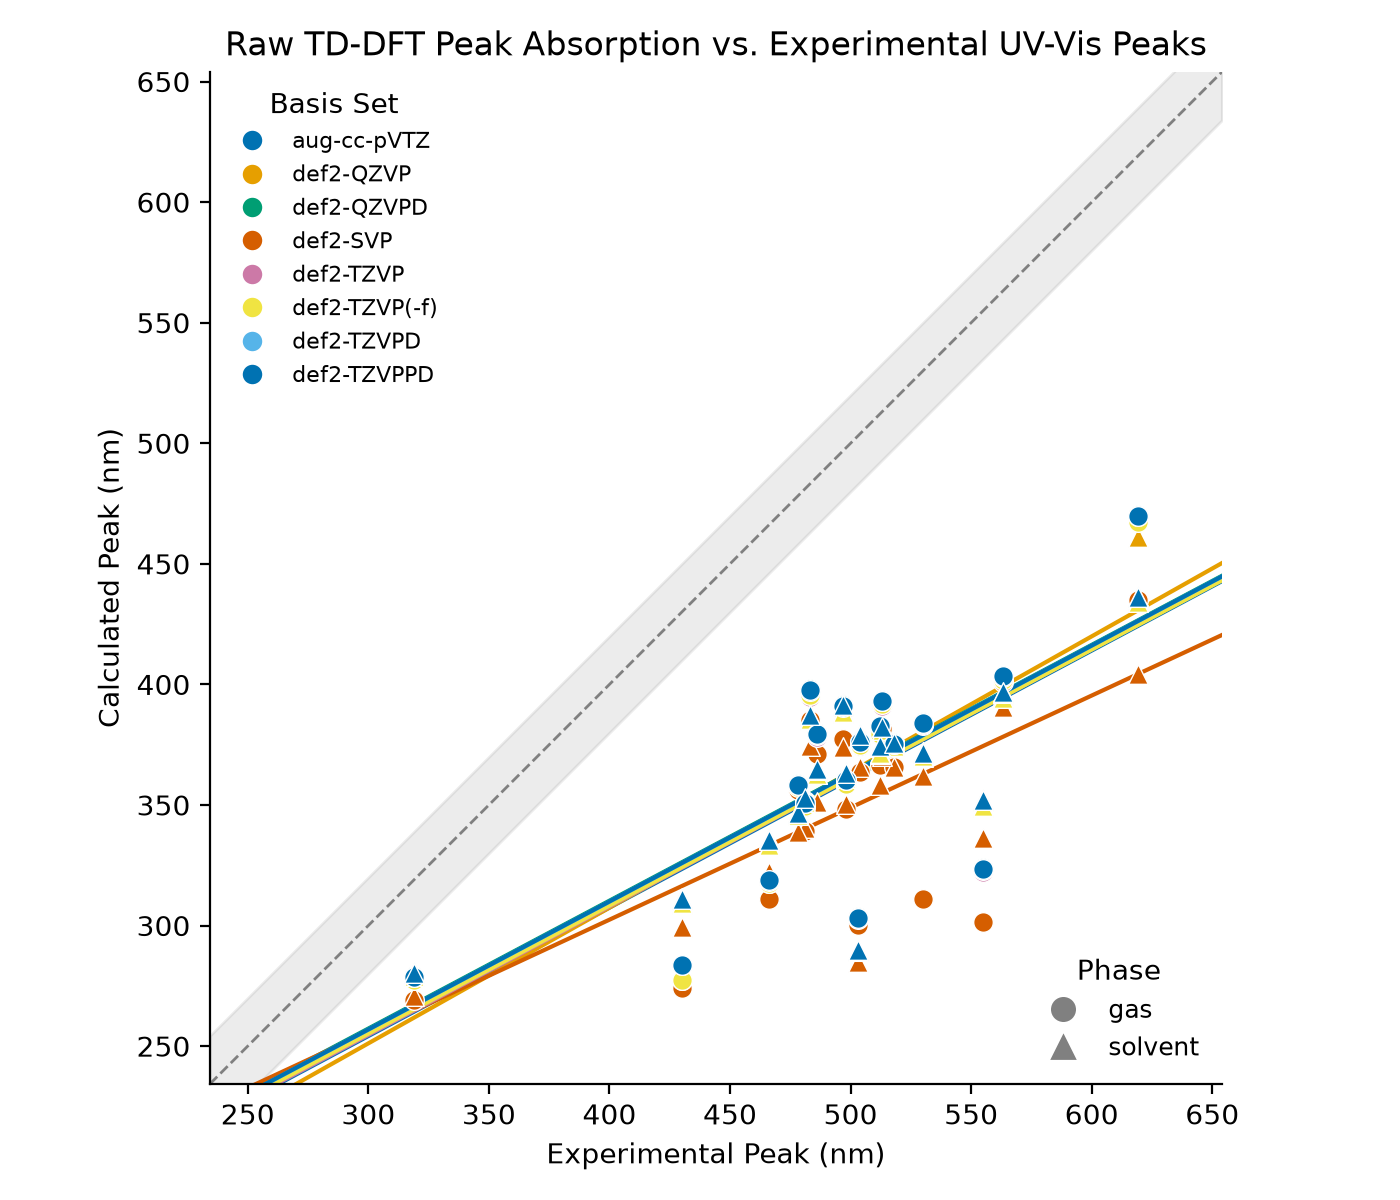
We next wanted to examine the effect of basis set choice on our full set of azo dyes. We ran these calculations with the ωB97X-D3 functional.
These tests show little to no effect of basis set choice. Accuracy on this set of compounds does not appear to be limited by our choice of basis set.
| Basis set | Phase | n | R2 | MAE | RMSE |
|---|---|---|---|---|---|
| def2-SVP | gas | 18 | 0.43 | 149.82 | 156.33 |
| def2-SVP | solvent | 18 | 0.59 | 149.70 | 154.83 |
| def2-TZVP | gas | 18 | 0.55 | 136.52 | 142.14 |
| def2-TZVP | solvent | 18 | 0.60 | 138.69 | 143.94 |
| def2-TZVP(-f) | gas | 18 | 0.55 | 136.33 | 141.95 |
| def2-TZVP(-f) | solvent | 18 | 0.59 | 138.60 | 143.87 |
| def2-TZVPD | gas | 18 | 0.55 | 134.78 | 140.51 |
| def2-TZVPD | solvent | 18 | 0.59 | 136.90 | 142.25 |
| def2-TZVPPD | gas | 18 | 0.55 | 134.73 | 140.47 |
| def2-TZVPPD | solvent | 18 | 0.59 | 136.83 | 142.19 |
| aug-cc-pVTZ | gas | 16 | 0.56 | 135.97 | 141.69 |
| aug-cc-pVTZ | solvent | 16 | 0.60 | 137.23 | 142.70 |
| def2-QZVP | gas | 18 | 0.55 | 135.20 | 140.95 |
| def2-QZVP | solvent | 19 | 0.66 | 138.08 | 143.20 |
| def2-QZVPD | gas | 18 | 0.55 | 134.40 | 140.16 |
| def2-QZVPD | solvent | 18 | 0.59 | 136.55 | 141.93 |
Fitting to Experimental Data
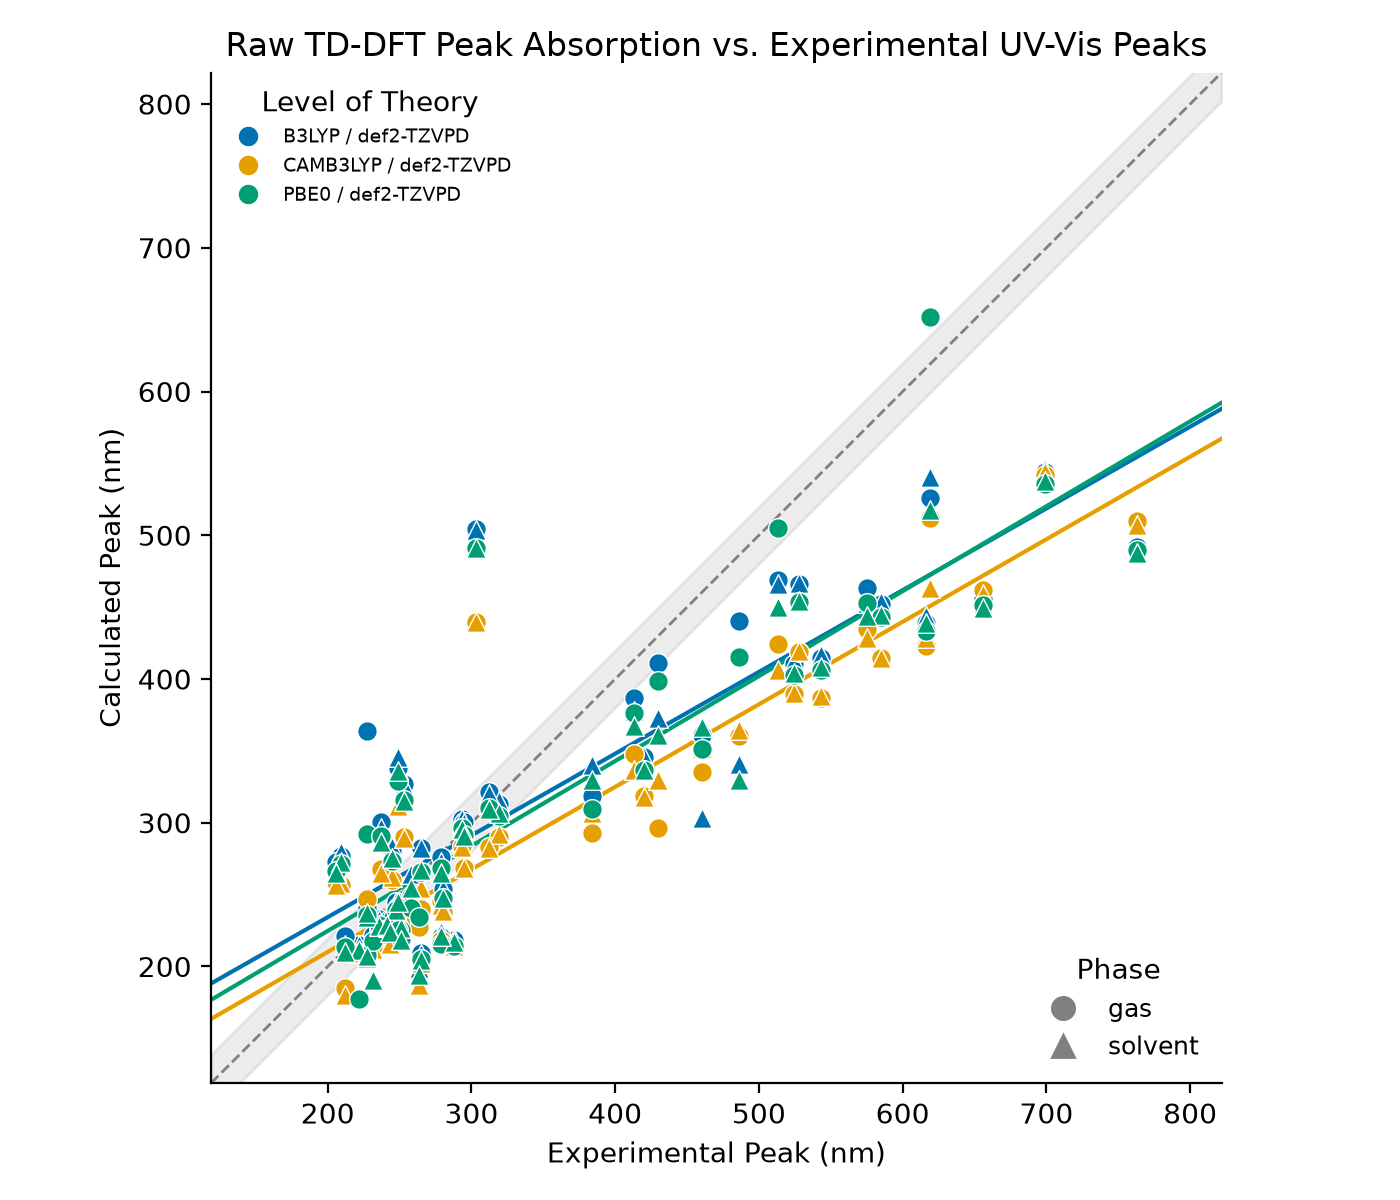
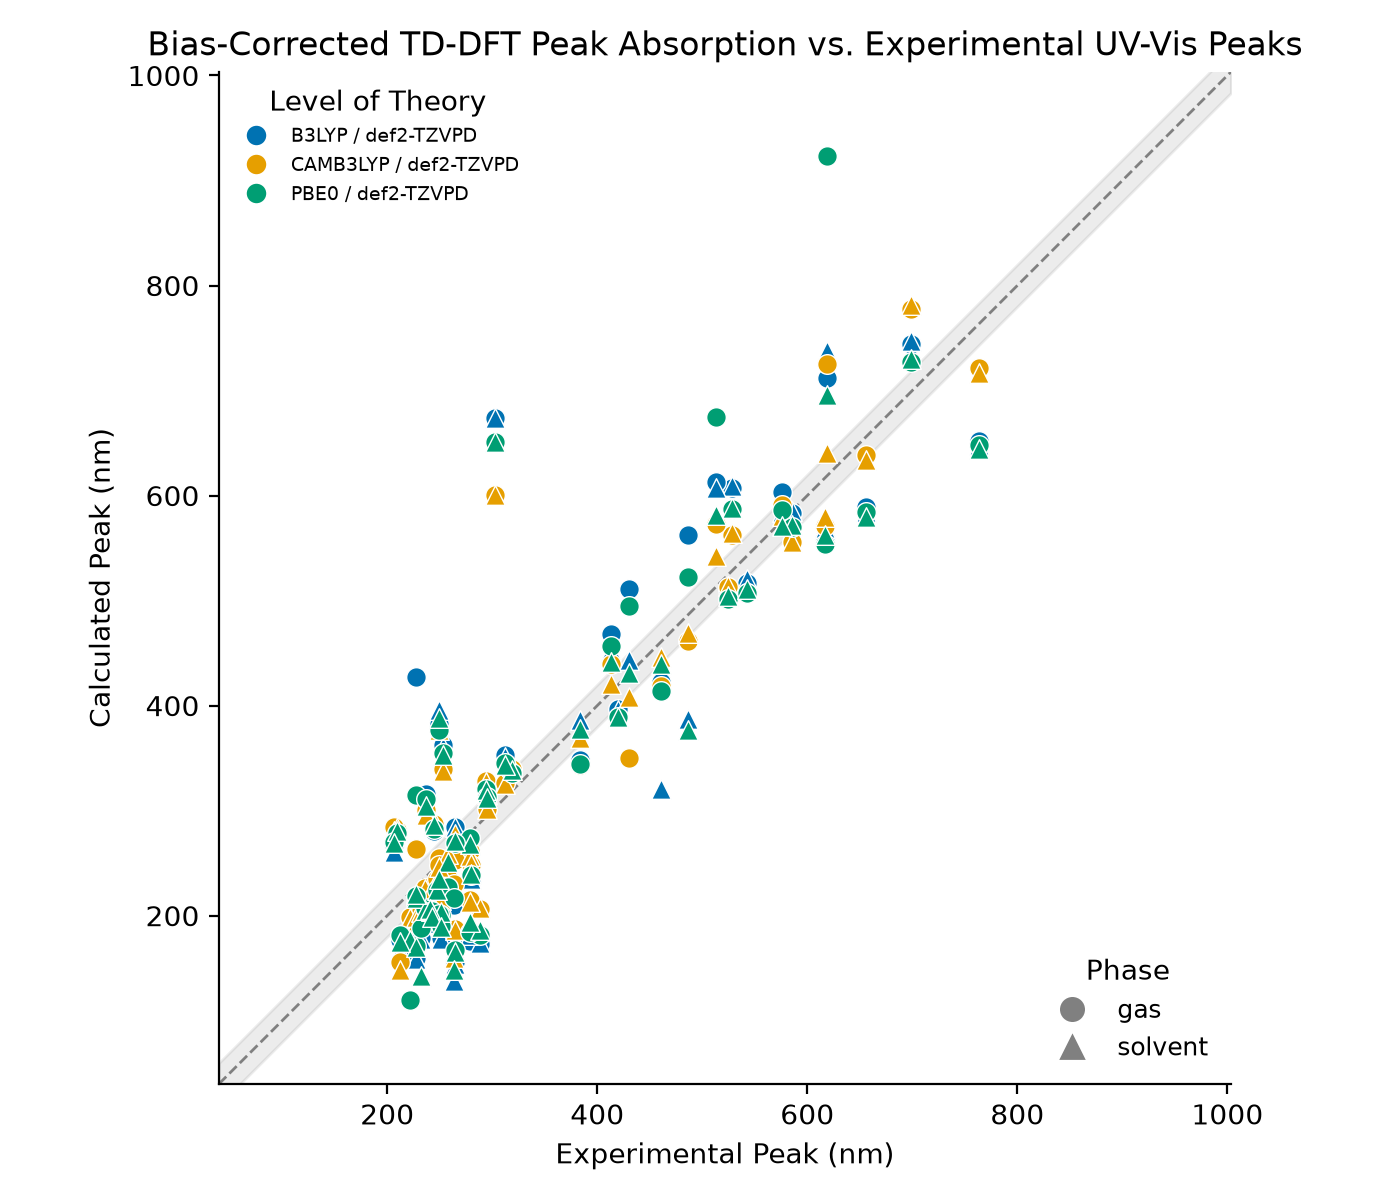
To correct the seeming consistent underprediction of TDDFT, we thought it be interesting to first run a set of predictions on a "train set" that we would use to derive a linear fit (of the form y=mx+b) and then evaluate the performance on a separate "test set."
We performed a Butina split on 100 compounds sampled from the PhotochemCAD database using Chalcedon with default settings, yielding two sets with 50 compounds each. TDDFT single-points were run using PBE0, B3LYP, and CAM-B3LYP; all functionals were run with the def2-TZVPD basis set.
Train Set
| Method | Phase | n | R2 | MAE | RMSE | MAE (fit) | RMSE (fit) |
|---|---|---|---|---|---|---|---|
| B3LYP | gas | 50 | 0.7563 | 60.05 | 85.89 | 51.10 | 74.40 |
| B3LYP | solvent | 50 | 0.7595 | 61.83 | 88.10 | 50.55 | 73.90 |
| PBE0 | gas | 50 | 0.7560 | 60.17 | 85.57 | 52.34 | 74.44 |
| PBE0 | solvent | 50 | 0.7846 | 63.48 | 89.04 | 47.29 | 69.94 |
| CAMB3LYP | gas | 50 | 0.8599 | 68.37 | 90.86 | 37.93 | 56.40 |
| CAMB3LYP | solvent | 50 | 0.8540 | 70.05 | 92.09 | 37.97 | 57.58 |
Here are the linear fits learned from the train set:
| Method | Phase | n | Slope | Intercept (nm) |
|---|---|---|---|---|
| B3LYP | gas | 50 | 1.3285 | −78.3820 |
| B3LYP | solvent | 50 | 1.3366 | −72.2248 |
| PBE0 | gas | 50 | 1.2318 | −39.4870 |
| PBE0 | solvent | 50 | 1.3811 | −77.6932 |
| CAMB3LYP | gas | 50 | 1.4841 | −89.3805 |
| CAMB3LYP | solvent | 50 | 1.5009 | −94.2435 |
Test Set
On held-out data, the fit clearly improves both CAMB3LYP variants, modestly improves solvent PBE0, is mixed for solvent B3LYP, and worsens the two gas-phase B3LYP/PBE0 models. This makes it seem like fits can be helpful within series but don't address a universal shortcoming in TDDFT.
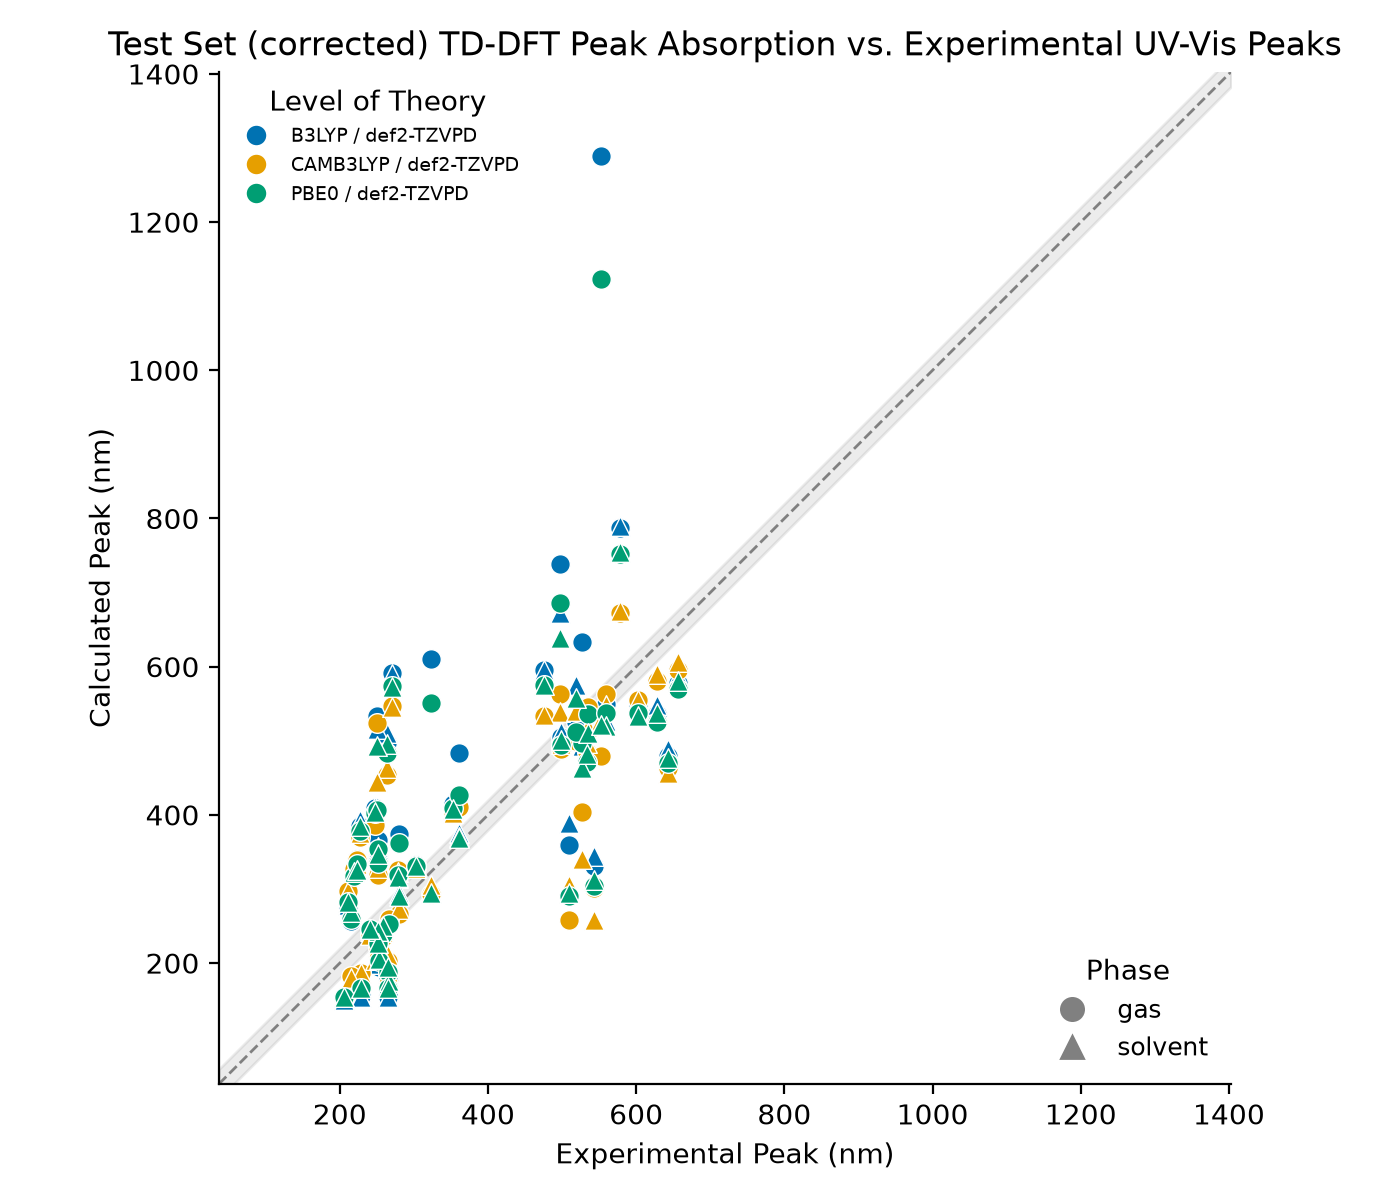
| Method | Phase | n | R2 | MAE | RMSE | MAE (fit) | RMSE (fit) |
|---|---|---|---|---|---|---|---|
| B3LYP | gas | 48 | 0.4285 | 84.69 | 112.59 | 95.65 | 129.97 |
| B3LYP | solvent | 48 | 0.5496 | 76.48 | 102.44 | 77.56 | 100.41 |
| PBE0 | gas | 48 | 0.4524 | 82.11 | 109.97 | 87.75 | 114.57 |
| PBE0 | solvent | 48 | 0.5351 | 78.77 | 106.79 | 76.25 | 101.34 |
| CAMB3LYP | gas | 48 | 0.5427 | 87.52 | 115.26 | 71.66 | 99.45 |
| CAMB3LYP | solvent | 48 | 0.5845 | 86.46 | 114.63 | 64.84 | 94.83 |
Limitations
This work doesn't do any conformer weighting. In cases where multiple low-lying conformers are found, each should be modeled separately and their UV-Vis spectra should be combined in proportion with their Boltzmann weights.
Additionally, this work only considered λmax; a more thorough study would look at the accuracy of entire predicted spectra.
For more information and other nuances, read our TDDFT documentation.
Conclusion
TDDFT can predict trends that match experimental values, but it's still not an ideal tool; it's not accurate enough on its own to be treated as a one-shot spectra predictor the way IR and NMR spectra prediction tools can be. Instead, it's important to use TDDFT as a tool to predict relative shifts; there are a number of knobs that control accuracy, and it's recommended to evaluate its effectiveness against similar compounds before employing it in a prospective setting.
We're excited to pursue this problem further and hope to encode best practices into our workflows to help make UV-Vis prediction more robust, accurate, and scalable. If you're interested in predicting molecular color or other excited-state properties with Rowan tools, please get in touch with our team at contact@rowansci.com.
Appendix
Appendix A: Selected 19 Azo Dyes
| Name | SMILES | λmax | Solvent | In set of 10? |
|---|---|---|---|---|
| Azobenzene | c1ccc(/N=N/c2ccccc2)cc1 | 319 | Benzene | Yes |
| Acid Red 2 | CN(C)C1=CC=C(C=C1)/N=N/C2=CC=CC=C2C(=O)O | 430 | Water | Yes |
| Methyl Orange | CN(C)c1ccc(/N=N/c2ccc(S(=O)(=O)O)cc2)cc1 | 466 | Water | Yes |
| Orange G | Oc1ccc2cc(cc(c2c1\N=N\c3ccccc3)S(=O)(=O)O)S(=O)(=O)O | 478 | Water | Yes |
| Orange II | O=S(=O)(O)c1ccc(/N=N/c2ccc3ccccc3c2O)cc1 | 486 | Water | Yes |
| Acid Red 88 | C1=CC=C2C(=C1)C=CC(=C2/N=N/C3=CC=C(C4=CC=CC=C43)S(=O)(=O)O)O | 503 | Water | Yes |
| Sudan I | Oc1ccc2ccccc2c1/N=N/c1ccccc1 | 481 | Ethanol | Yes |
| Sudan II | Oc1ccc2ccccc2c1/N=N/c1ccc(C)cc1C | 498 | Ethanol | Yes |
| Acid Violet 3 | Nc1ccc(/N=N/c2c(O)c3cc(S(=O)(=O)O)cc(S(=O)(=O)O)c3cc2O)cc1 | 555 | Water | Yes |
| Acid Red 1 | CC(Nc(cc(S(=O)(O)=O)c1)c2c1cc(S(=O)(O)=O)c(/N=N/c3ccccc3)c2O)=O | 530 | Water | No |
| Acid Red 14 | O=S(=O)(O)c1ccc(/N=N/c2cc(S(=O)(=O)O)c3ccccc3c2O)c2ccccc12 | 512 | Water | No |
| Acid Blue 92 | C1=CC=C(C=C1)NC2=C3C(=C(C=C2)/N=N/C4=C5C(=CC(=C4)S(=O)(=O)O)C=C(C=C5O)S(=O)(=O)O)C=CC=C3S(=O)(=O)O | 563 | Water | No |
| Sudan III | Oc1ccc2ccccc2c1/N=N/c1ccc(/N=N/c2ccccc2)cc1 | 504 | Ethanol | Yes |
| Sudan IV | Oc1ccc2ccccc2c1/N=N/c1ccc(/N=N/c2ccccc2C)cc1C | 518 | Ethanol | No |
| Acid Black 1 | Nc1c(/N=N/c2ccc(cc2)N+[O-])c(cc3cc(c(/N=N/c4ccccc4)c(O)c13)S(=O)(=O)O)S(=O)(=O)O | 619 | Water | No |
| Ponceau S | OS(C(C=C1)=CC=C1/N=N/C2=CC=C(/N=N/C3=C(O)C(S(=O)(=O)O)=CC4=C3C=CC(S(=O)(=O)O)=C4)C(S(=O)(=O)O)=C2)(=O)=O | 513 | Water | No |
| Congo Red | C1=CC=C2C(=C1)C(=CC(=C2N)/N=N/C3=CC=C(C=C3)C4=CC=C(C=C4)/N=N/C5=C(C6=CC=CC=C6C(=C5)S(=O)(=O)O)N)S(=O)(=O)O | 483 | Water | No |
| Benzopurpurin 4B | CC1=C(C=CC(=C1)C2=CC(=C(C=C2)/N=N/C3=C(C4=CC=CC=C4C(=C3)S(=O)(=O)O)N)C)/N=N/C5=C(C6=CC=CC=C6C(=C5)S(=O)(=O)O)N | 497 | Water | No |
| Evans Blue | CC1=C(C=CC(=C1)C2=CC(=C(C=C2)/N=N/C3=C(C4=C(C=C3)C(=CC(=C4N)S(=O)(=O)O)S(=O)(=O)O)O)C)/N=N/C5=C(C6=C(C=C5)C(=CC(=C6N)S(=O)(=O)O)S(=O)(=O)O)O | 606 | Water | No |
Appendix B: Classes of Final Compounds
These classes do not represent the clusters, just the composition of what types of molecules were in the final test and train sets.
| Class | Test | Train | Total |
|---|---|---|---|
| Aromatic hydrocarbons | 1 | 11 | 12 |
| Acridines | 8 | 3 | 11 |
| Heterocycles | 4 | 7 | 11 |
| Azo dyes | 3 | 5 | 8 |
| Oligophenylenes | 3 | 4 | 7 |
| Polycyclic aromatic hydrocarbons | 6 | 1 | 7 |
| Biomolecules | 3 | 4 | 7 |
| Quinones | 6 | 0 | 6 |
| Xanthenes | 5 | 0 | 5 |
| Cyanine dyes | 1 | 4 | 5 |
| Arylmethane dyes | 1 | 3 | 4 |
| Coumarins | 2 | 2 | 4 |
| Porphyrins | 2 | 1 | 3 |
| Polyenes/polyynes | 1 | 2 | 3 |
| Chlorins/bacteriochlorins | 2 | 0 | 2 |
| Miscellaneous dyes | 1 | 1 | 2 |
| Oligopyrroles | 1 | 0 | 1 |
| Perylenes | 0 | 1 | 1 |
| Phthalocyanines | 0 | 1 | 1 |
| Total | 50 | 50 | 100 |