Do Boltz-2's Structure and Affinity Predictions Agree?
by Zachary Fried · Nov 9, 2026
Charles I in Three Positions, Anthony van Dyck (1635–1636)
When running Boltz-2 to predict binding affinity, it's natural to assume that the affinity score is calculated using the protein–ligand structure returned by the model. However, the structure used for affinity prediction is actually generated separately from the initial cofolding structure, something that can easily be overlooked.
As recently investigated by Ujihara, these two structures can differ, sometimes substantially. We wanted to investigate how often this happens, how MSAs and physical potentials affect agreement between the two stages, and whether this agreement tells us anything about the accuracy of the initial prediction.
How Boltz-2 predicts binding affinity
Boltz-2's affinity prediction involves two rounds of structure generation. First, the model generates a full protein–ligand complex from the protein sequence and ligand SMILES, optionally using a multiple sequence alignment (MSA).
The predicted ligand position is then used to identify the binding pocket, retaining up to 200 protein tokens for affinity prediction. In the standard boltz-community implementation, the affinity checkpoint generates five new structures for this cropped complex, starting from random coordinates rather than refining the initial prediction. The structure with the highest ipTM is selected for affinity scoring.
Rowan's Boltz implementation uses this same default behavior, regardless of how many initial cofolding structures are requested. MSAs, when provided, are used in both stages, but the initial coordinates are not directly reused as a starting structure for affinity prediction.
How we tested the two structures
For this blog, we assembled a benchmark of 600 protein–ligand crystal structures from the PDB. Of these, 220 were released before June 1, 2023, the structural training cutoff reported in the original Boltz-2 paper, and 380 were released after that date.
More specifically, we selected reasonably high-resolution crystal structures (2.3 Å or better) with one protein chain of manageable size and relatively few missing residues. Ligands had moderate charges (−2 to +2) and mostly typical drug-like sizes, with some larger molecules for broader coverage. We excluded covalent and metal-mediated binding and limited repeated proteins and ligands to increase diversity.
We ran each complex four ways: with an MSA and without one, and for both of those settings, with physical potentials switched on or off. Rowan enables MSAs by default, while physical potentials are disabled by default.
We generated MSAs using MMseqs2 through the ColabFold server. We enabled physical potentials using Boltz-2's --use_potentials flag, which applies additional steering during initial structure prediction to encourage correct chirality, bond geometry, planarity, and other aspects of physical plausibility. These potentials are automatically disabled during the affinity stage, so we wanted to see whether enabling them would cause the two structures to disagree more.
This work used boltz-community version 2.10.8, the same version used in Rowan's current integration. Each prediction generated one initial structure and five affinity-stage candidates, with 200 diffusion steps per stage.
Comparing the structures
Boltz-2 does not typically export the structure selected for affinity scoring. We therefore modified the code to save this structure and verified that it was the exact pose used to calculate affinity.
To compare the two predictions, we aligned their shared protein Cα atoms and calculated the symmetry-corrected heavy-atom RMSD of the ligand. We did not separately align the ligands, so this measures how much the ligand pose changes relative to the protein.
We also compared protein–ligand contacts, defined as pairs of protein and ligand heavy atoms within 4 Å. We measured the fraction of initial contacts retained in the affinity-stage structure, considering only protein atoms included in the affinity crop.
Finally, we compared the initial structure predictions against their experimental PDB structures using the same protein-alignment approach. Protein RMSDs were calculated over the shared region rather than the entire protein.
We compared all 600 complexes between stages, and used 567 for comparisons to experiment after excluding 33 due to incomplete experimental ligands or unresolved stereochemistry/atom-mapping issues.
How different are the two structures?
With an MSA, the initial and affinity-stage structures generally agreed very well, with median ligand RMSDs of approximately 1.1–1.2 Å. However, significant disagreements remained, as approximately 13–14% exceeded 5 Å. Without an MSA, the differences were much larger, with median RMSDs of approximately 4.1–4.6 Å.
| Condition | Median ligand RMSD | Median 4 Å contact retention |
|---|---|---|
| MSA, potentials off | 1.17 Å | 68.4% |
| MSA, potentials on | 1.13 Å | 68.9% |
| No MSA, potentials off | 4.62 Å | 20.7% |
| No MSA, potentials on | 4.05 Å | 20.0% |
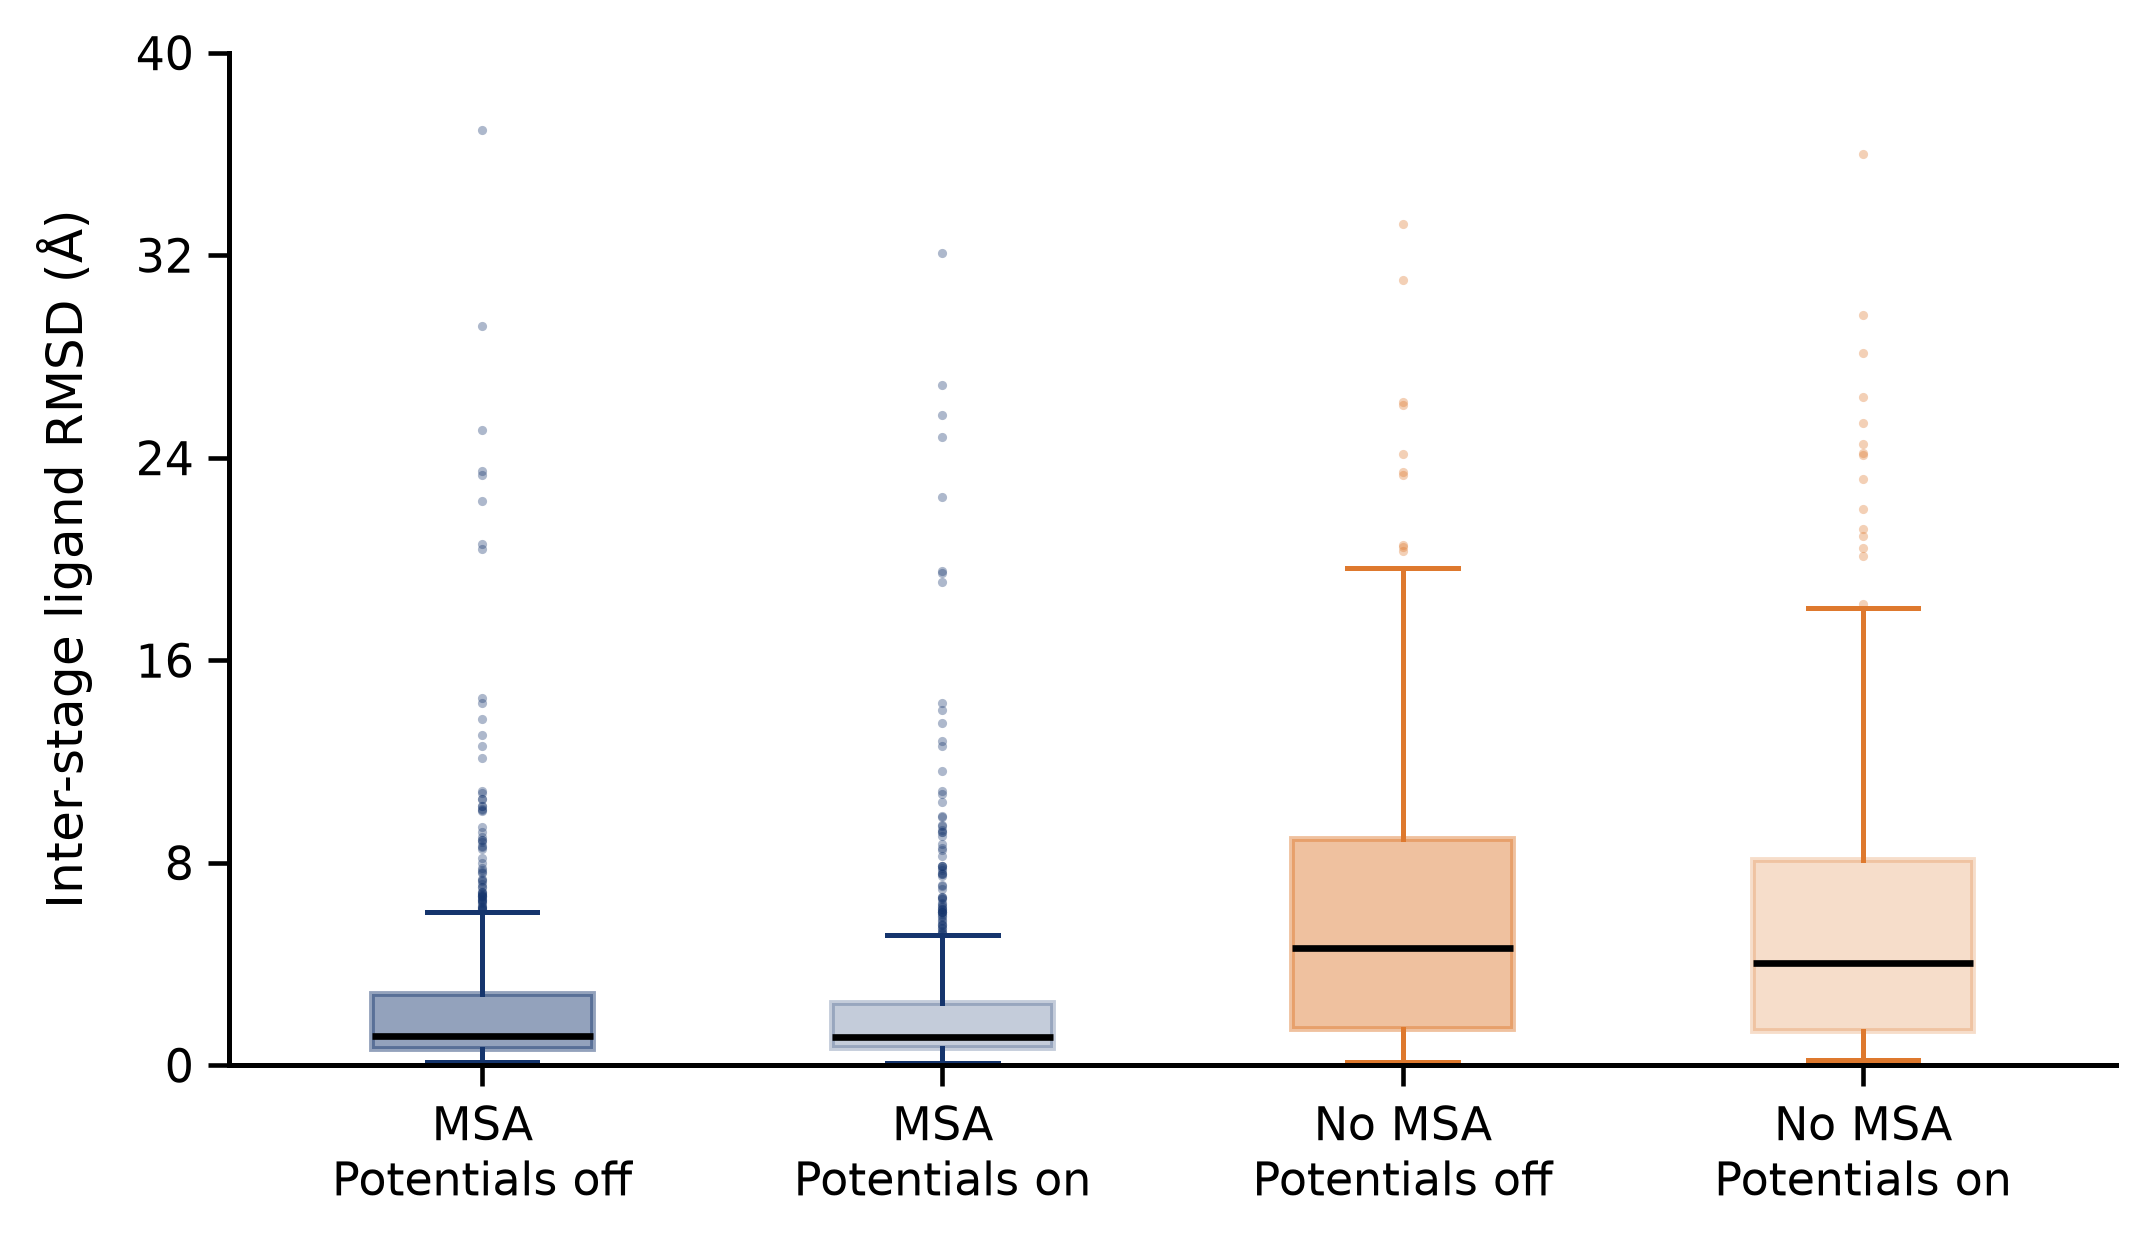
Figure 1: Distribution of inter-stage ligand RMSDs across the four conditions.
The contact analysis showed a similar trend. With an MSA, the median fraction of initial contacts retained was approximately 69%, compared with only 20–21% without an MSA.
Clearly, MSAs make a notable difference in how consistently the two stages predict ligand poses. We can also see this in individual examples, such as the complex shown below.
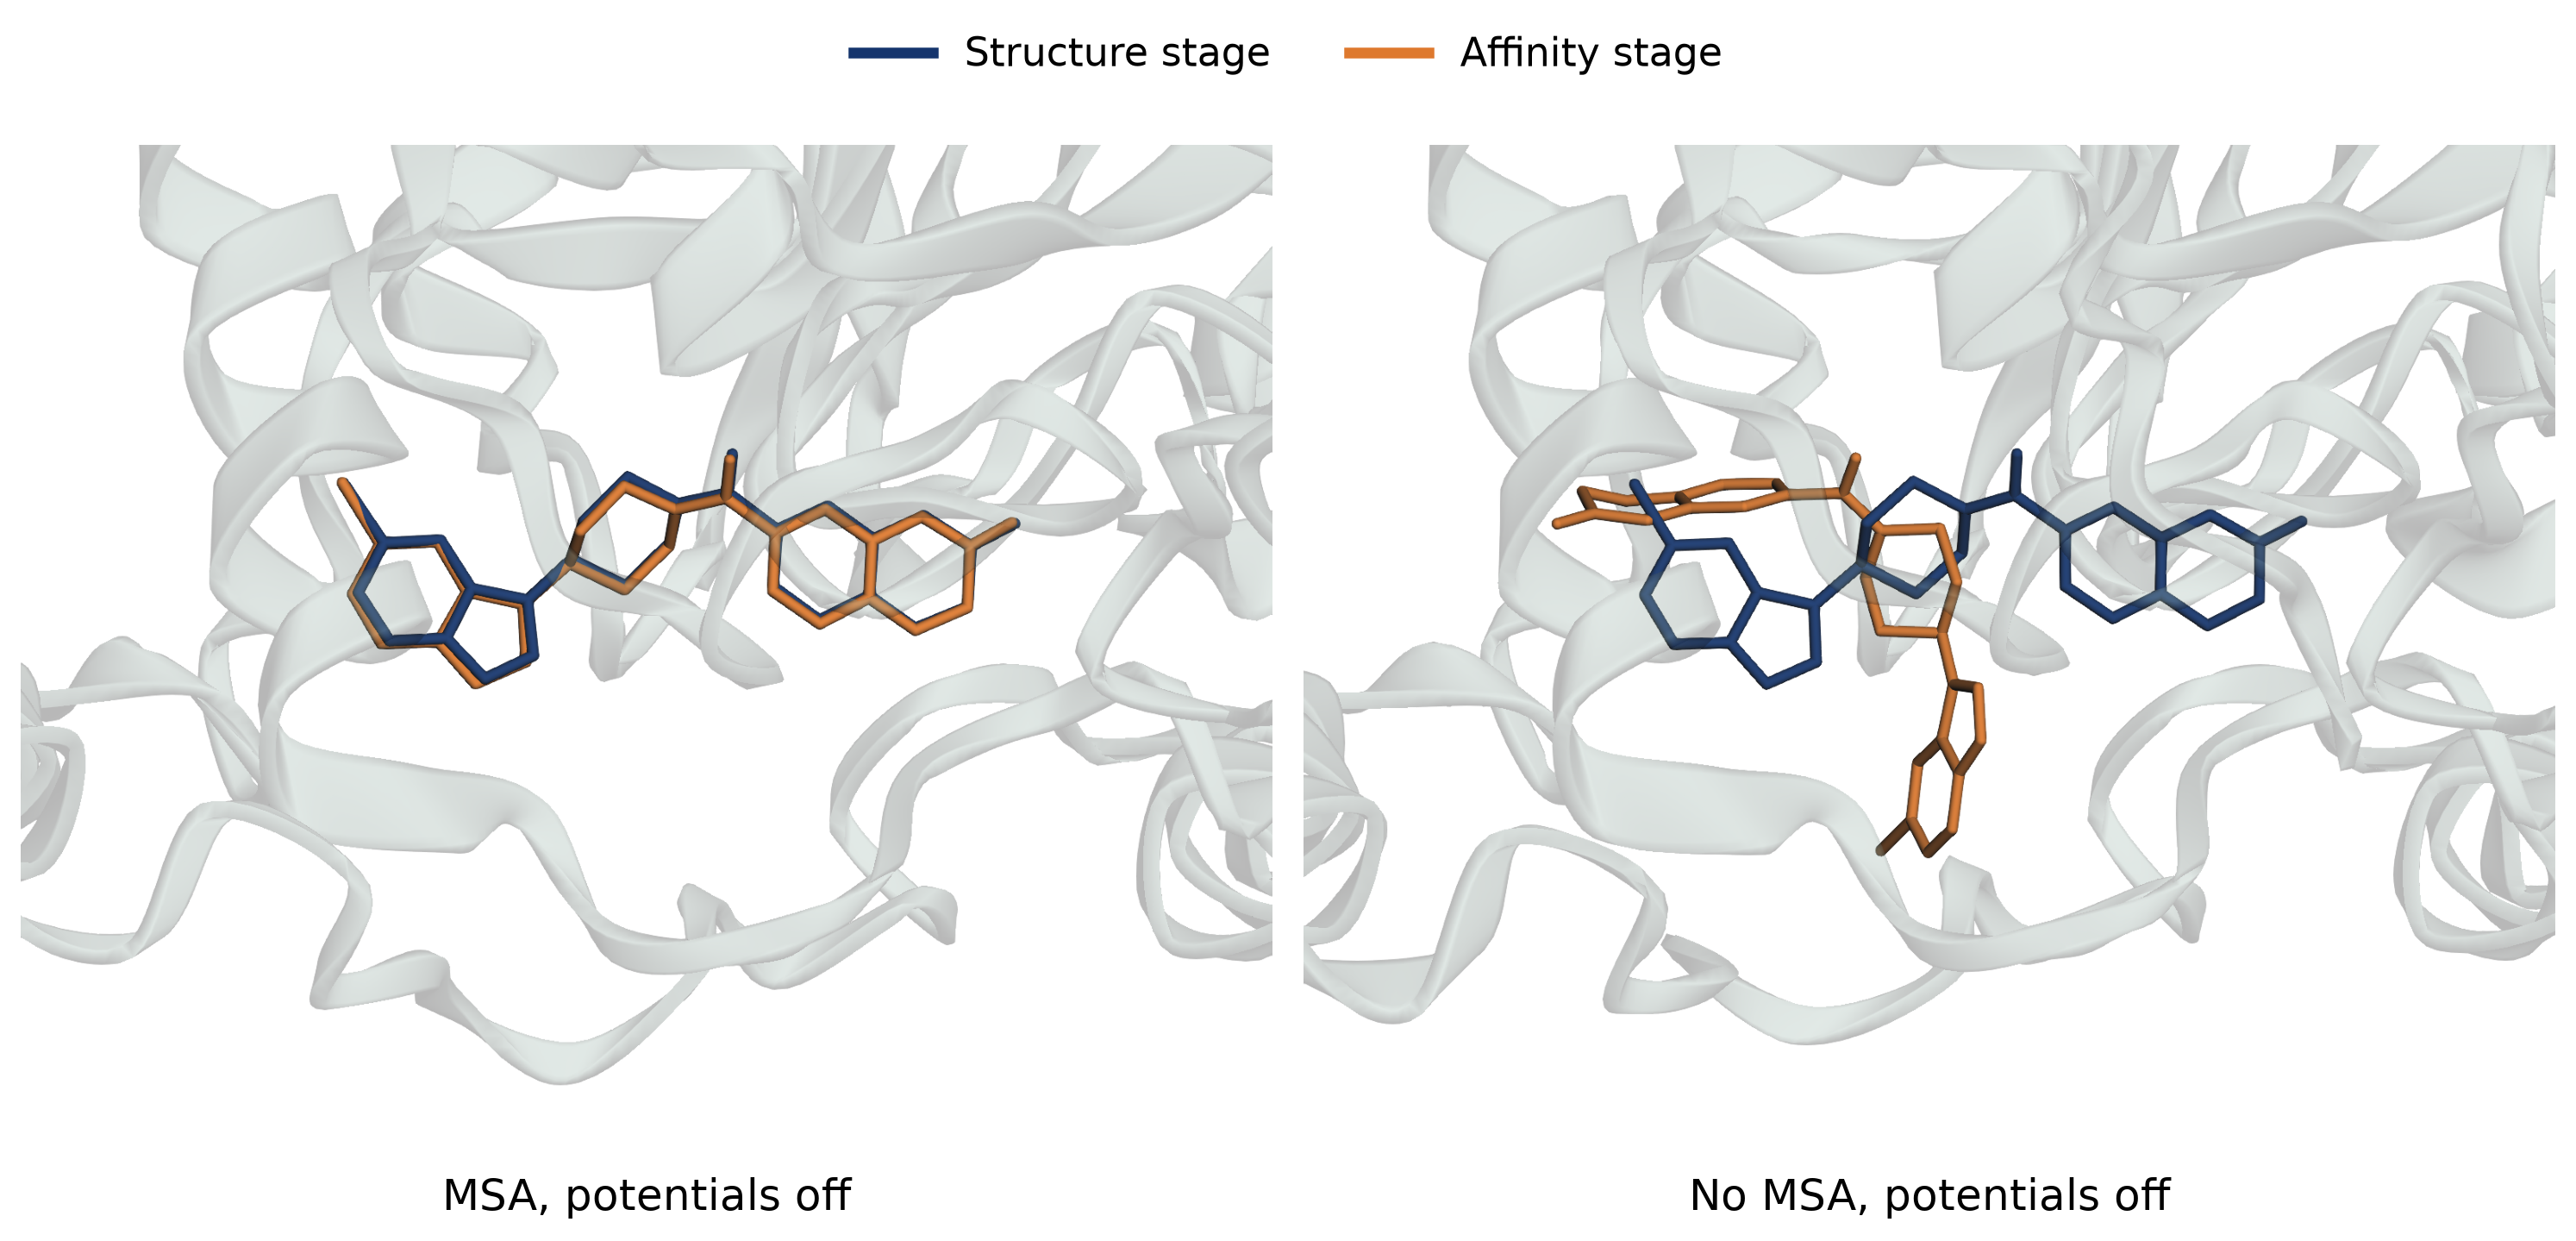
Figure 2: Initial and affinity-stage ligand poses for PDB 9F8D, with and without an MSA with physical potentials disabled. Inter-stage RMSD increases from 0.29 Å with an MSA to 9.20 Å without one. Navy represents the initial pose and orange the selected affinity-stage pose.
Interestingly, the initial structure for this example is accurate in both conditions, with an experimental ligand RMSD of approximately 0.29 Å. Despite that, the affinity-stage prediction moves substantially when the MSA is removed. This is a useful reminder that disagreement between the stages doesn't necessarily mean the initial prediction is wrong.
Does enabling physical potentials increase disagreement?
Since physical potentials are applied only during the initial prediction, we wondered whether enabling them would make the two stages disagree more.
Interestingly, we didn't observe this. The median change in inter-stage RMSD when enabling potentials was just −0.012 Å with an MSA and −0.075 Å without one. These small changes suggest that physical potentials have relatively little effect on typical inter-stage agreement, although they can still substantially affect individual structures.
For example, Ujihara found that enabling physical potentials corrected the ligand stereochemistry in the initial prediction for the chiral systems they tested, but not in the affinity-stage prediction, where those potentials were disabled. So while we didn't see a meaningful increase in median disagreement, there can still be important differences between the two structures.
How accurate is the initial structure?
Agreement between the two stages is interesting, but ultimately we want to know how closely the initial prediction matches the experimental structure.
With an MSA, the median ligand RMSD to experiment was 1.29–1.35 Å, with approximately 61% of poses within 2 Å of experiment. Without an MSA, median RMSDs increased to 4.14–4.85 Å, and only about 33–35% of poses were within 2 Å.
We also found that accuracy was lower for structures released after Boltz-2's reported structural training cutoff. The table below shows the physical-potentials-off conditions, matching Rowan's default setting.
| PDB release date | MSA | Median initial ligand RMSD | Initial poses within 2 Å |
|---|---|---|---|
| Before June 1, 2023 | On | 1.08 Å | 72.5% |
| After June 1, 2023 | On | 1.62 Å | 53.9% |
| Before June 1, 2023 | Off | 3.23 Å | 40.6% |
| After June 1, 2023 | Off | 5.59 Å | 27.8% |
With an MSA, the initial predictions were within 2 Å of experiment for 72.5% of pre-cutoff structures, compared with 53.9% afterward. We saw a similar pattern with physical potentials enabled.
Removing the MSA also made the predicted protein structures substantially less accurate. For example, in the post-cutoff group with potentials disabled, median protein Cα RMSD increased from 0.82 to 3.08 Å when the MSA was removed.
Can agreement between the stages help predict pose accuracy?
One interesting question is whether agreement between the two stages could help identify inaccurate initial ligand poses.
We compared the RMSD between stages with the experimental RMSD of the initial structure. The two were correlated, with Spearman correlations of approximately 0.60–0.63 with an MSA and 0.68–0.71 without one. In other words, when the stages disagreed more, the initial ligand pose also tended to be less accurate.
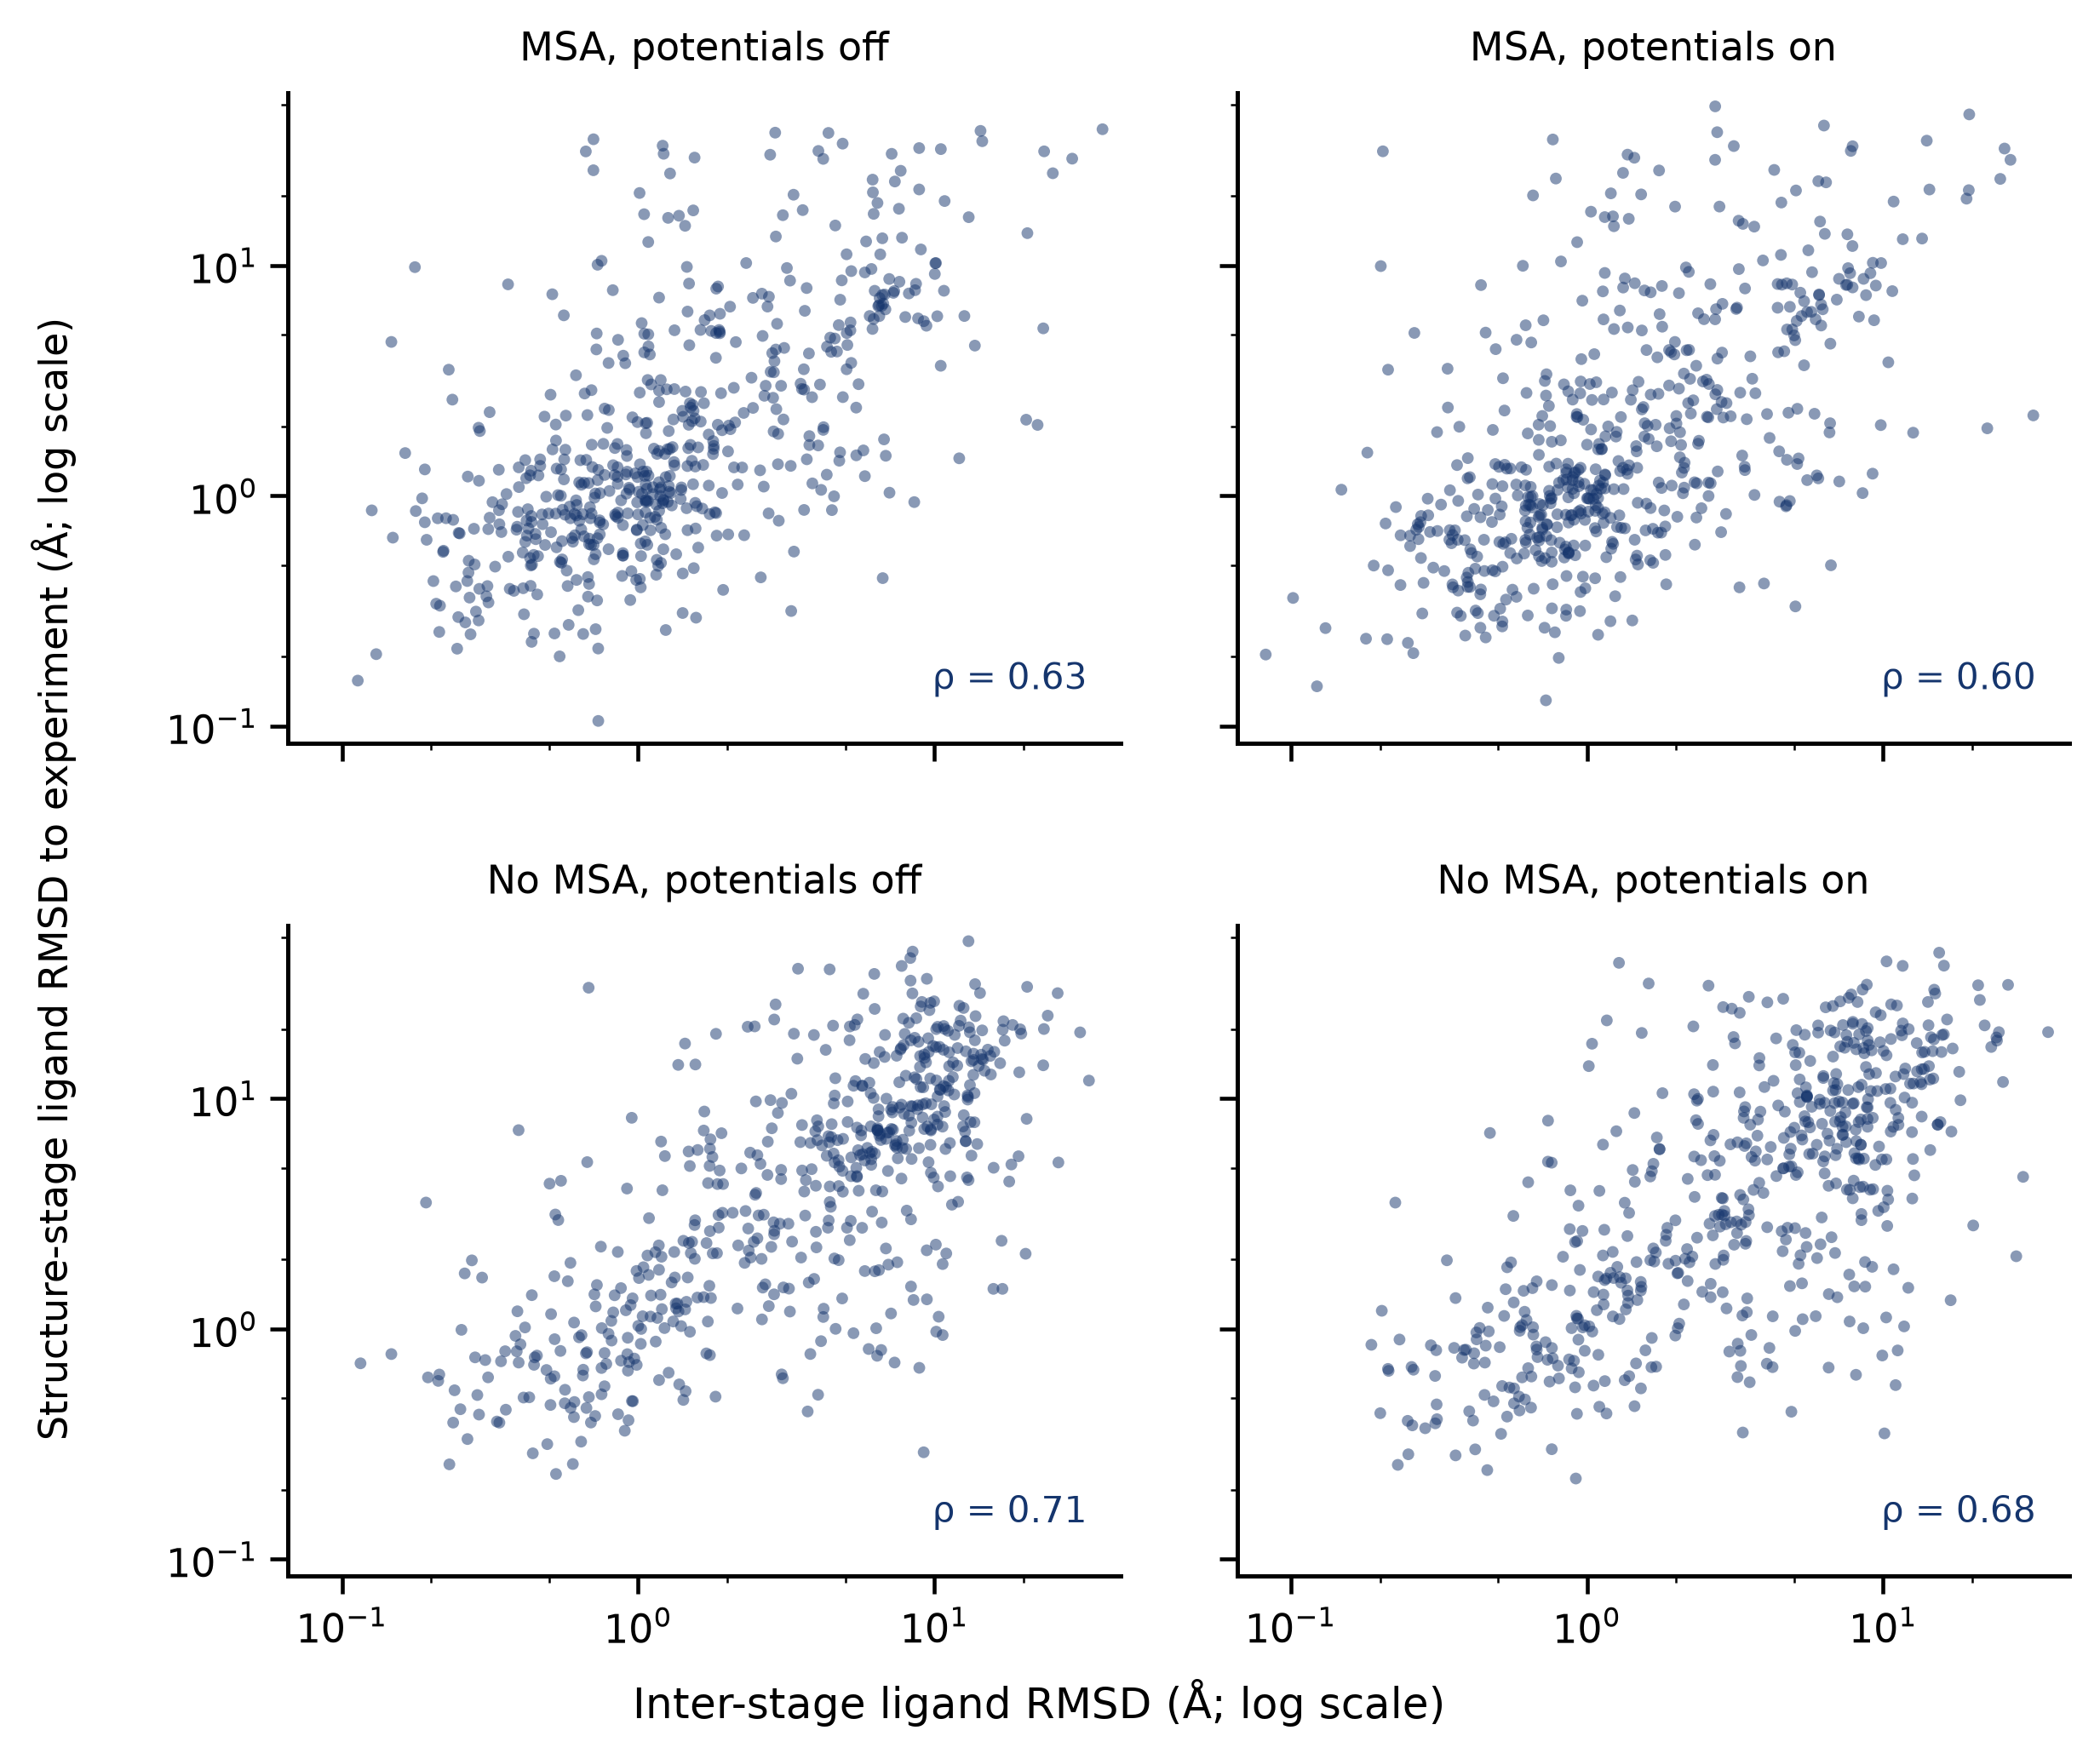
Figure 3: Inter-stage ligand RMSD versus experimental ligand RMSD of the initial structure, separated by MSA and physical-potential settings.
This isn't terribly surprising. If Boltz-2 has difficulty identifying a reliable binding pose, its two structure-generation stages may be more likely to produce different answers.
However, the initial structure's ipTM was slightly more strongly correlated with experimental ligand RMSD (Spearman ρ = −0.66 to −0.75) than inter-stage disagreement (ρ = 0.60 to 0.71), suggesting that comparing the two structures may not provide much additional information beyond ipTM alone.
Ultimately, agreement is only a potential indicator of reliability. As the 9F8D example shows, the stages can disagree even when the initial pose is accurate, and they could also agree on an incorrect pose.
How much do different poses affect predicted affinity?
So far, we've focused on how much the ligand poses differ between stages. But since the affinity-stage structures aren't normally returned to the user, the more important question is whether these differences actually affect the predicted binding affinity.
To investigate this, we tested 25 complexes, including the 9F8D example discussed above, with and without an MSA and with physical potentials disabled. For each condition, we kept the initial prediction and the set of residues in the affinity crop fixed, then ran the affinity stage five times with different random seeds. Each run generated five candidate structures and selected the one with the highest ipTM, giving us five selected poses and affinity predictions to compare.
We tested these poses in two ways. First, we rescored all five using the same internal representations from one reference run. These representations contain information about the protein, ligand, and their interactions, and are calculated before the new structures are generated. Keeping them fixed lets us isolate the effect of changing the protein and ligand coordinates, while the scorer still recalculates distances and other geometry-dependent features for each pose. This follows the same general idea as Ujihara's fixed-input comparisons. We rescored complete protein–ligand structures selected from separate affinity-stage runs.
Second, we compared the affinity predictions Boltz-2 originally returned for those same five poses. Here, each structure was scored using the internal representations calculated during its own run. These can differ between runs, for example because Boltz-2 may randomly select different sequences from the same MSA.
The main limitation of the first approach is that we use one run's internal representations to score all five affinity-stage structures. Those representations may be better suited to that run's own structure than to the structures from the other runs. Both comparisons also keep the set of residues in the affinity crop fixed, and neither tests accuracy against experimental binding affinities.
Across all 25 complexes, the median largest pairwise ligand RMSD among the five selected affinity-stage structures was 2.0 Å with an MSA and 10.5 Å without one. Despite these differences, when we kept the internal representations fixed, the median range in predicted IC50 was just 1.16-fold and 1.20-fold, respectively. Here, predicted IC50 refers to Boltz-2's IC50-like affinity output, which was trained on several types of experimental affinity measurements. These fold ranges compare the highest and lowest predicted IC50 values after converting the model's log-scale outputs to linear values. Predicted binding probabilities also changed very little, with median ranges of 1.25 and 1.65 percentage points. Even the largest IC50 differences in this controlled comparison were below twofold. For example, in 8HS7 with an MSA, selected ligand poses differed by as much as 20.7 Å, yet the predicted IC50 varied by only 1.55-fold across the five poses. These results support Ujihara's finding that changing the predicted structure while keeping the model's earlier calculations fixed often has relatively little effect on predicted affinity.
Looking at the normal affinity predictions, the median IC50 ranges were still small, at 1.28-fold with an MSA and 1.20-fold without one. However, there were exceptions. For 9X56 with an MSA, two runs generated ligand poses 11.78 Å apart, while the protein structures differed by only 0.66 Å Cα RMSD. Their predicted IC50 values differed by 3.83-fold. Across all five runs, binding probability varied by 17.7 percentage points. When we rescored those same poses with fixed internal representations, the full IC50 and binding-probability ranges dropped to just 1.15-fold and 1.8 percentage points.
Overall, Boltz-2 often predicted similar binding affinities even when the generated structures differed substantially. Changing the affinity-module coordinates alone generally had little effect on the affinity score in these systems, while normal reruns could sometimes show larger differences because other information used by the model also changed. However, similar predictions aren't necessarily accurate, and we haven't tested them against experimental binding affinities.
Brief final thoughts
Although the two stages can occasionally produce notably different ligand poses, with an MSA they generally agree quite well, with a median inter-stage RMSD of around 1.1 Å. That's encouraging given that affinity inference generates a new structure rather than refining the first. Our results support keeping MSAs enabled when running Boltz-2 on Rowan.
Inter-stage disagreement was associated with poorer experimental pose accuracy, although ipTM was slightly more strongly correlated. We also found that even substantial differences among affinity-stage structures often had relatively little effect on the predicted affinity when the scorer's other inputs were held fixed, consistent with Ujihara's findings.
Since we had to modify the Boltz-2 code to access the structure used for affinity scoring, a more straightforward follow-up would be to see whether differences between multiple samples from the initial structure-prediction stage show a similar relationship with pose accuracy.