Benchmarking Protein–Ligand Interaction Energy
by Ishaan Ganti · Jul 11, 2025
Accurately modeling protein–ligand (PL) interactions is core to structure-based drug design. While computing individual protein–ligand interaction energies is a necessary first step in any binding-affinity-prediction workflow, this computation can be quite challenging. Conventional forcefields like those used in molecular dynamics often get non-covalent interactions wrong. Quantum-chemical methods like density-functional theory (DFT) are much more accurate, but are typically unable to scale to the requisite number of atoms. For many complexes, even pruning all residues more than 10 Å away from the ligand still leaves 600–2000 atoms in the truncated system, too many for DFT to routinely handle.
Low-cost methods like neural network potentials (NNPs) and tight-binding semiempirical methods have becoming increasingly popular in the past few years. These methods give near-DFT accuracy for small molecules but run orders of magnitude faster than DFT or other quantum-chemical methods. However, it remains an open question whether NNPs and semiempirical methods can scale to protein-scale computations with good accuracy; most NNPs are trained only on small organic molecules or periodic systems, often with fewer than a hundred atoms.
Benchmarking protein–ligand interaction energies is challenging because, as discussed above, the systems are too large to directly run reference quantum-chemical calculations. In 2020, Kristian Kříž and Jan Řezáč addressed this problem by publishing the PLA15 benchmark set, which uses fragment-based decomposition to estimate the interaction energy for 15 protein–ligand complexes at the DLPNO-CCSD(T) level of theory. A recent LinkedIn post from Řezáč showed that the new g-xTB method performed well, but didn't include some of the other computational methods we often consider using here at Rowan.
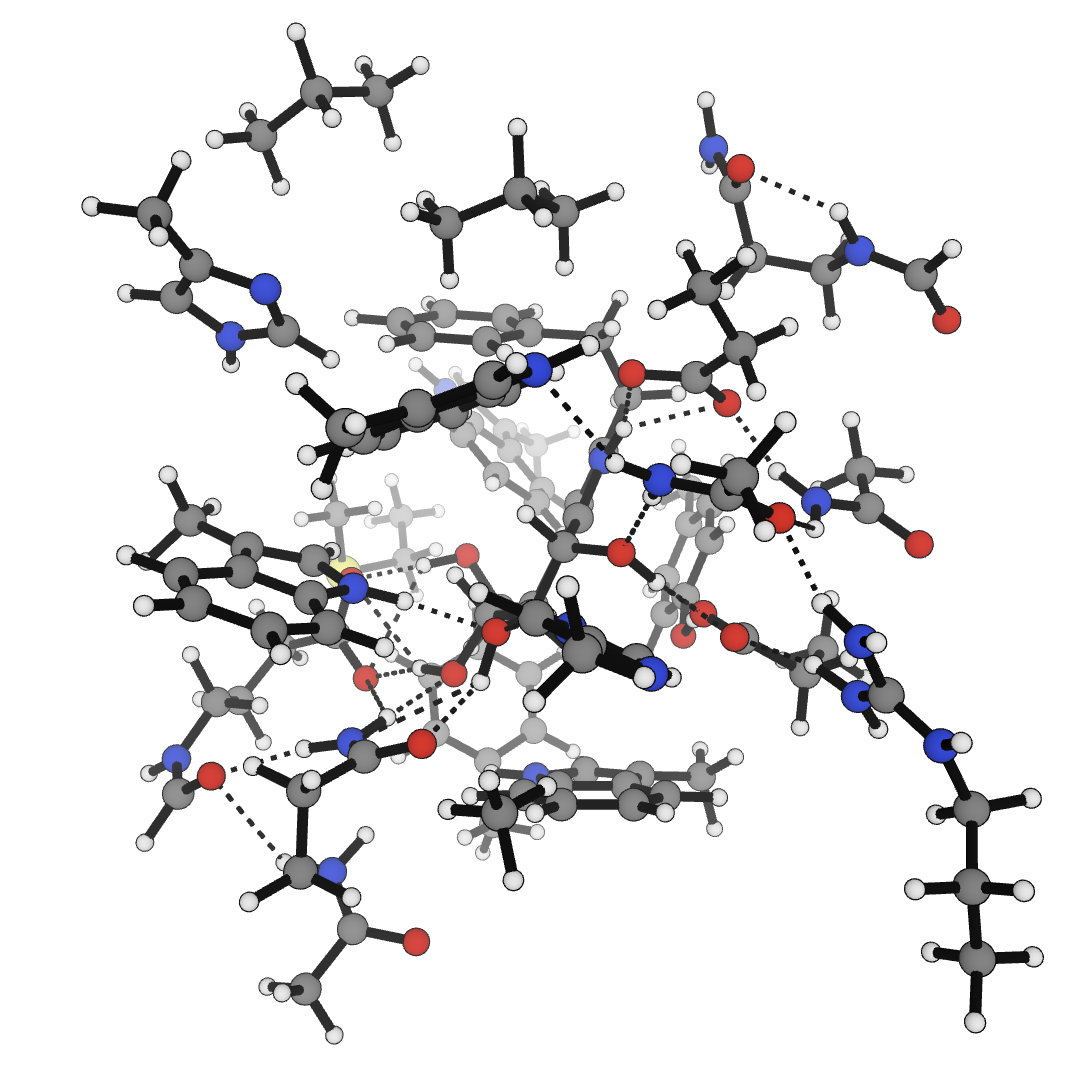
Visualization of the 2CET complex from the PLA15 benchmark set.
We benchmarked a variety of low-cost computational methods against PLA15:
- We looked at two NNPs trained on periodic materials-science data (Orb-v3 and MACE-MP-0b2-L). Orb-v3 has previously been used for simulating potassium-ion channels and enzyme mechanism and is designed to scale to large systems like those studied here.
- We looked at six NNPs trained on molecular data (ANI-2x, AIMNet2, Egret-1, eSEN-OMol25-sm-conserving, UMA-s, and UMA-m). The last three models were all trained by Meta's FAIR-chem team on the large OMol25 molecular dataset. Among these NNPs, there are substantial differences: ANI-2x and Egret-1 don't handle charge at all, while the models trained on OMol25 take charge as an input feature and AIMNet2 computes Coulombic interactions via explicit physics-based terms. AIMNet2 can optionally employ Gezelter's damped-shifted-force approximation; we evaluated AIMNet2 both with and without this approximation.
- Finally, we looked at two semiempirical methods—GFN2-xTB and g-xTB, both from Stefan Grimme and co-workers—and the related GFN-FF polarizable forcefield.
Here are the results, showing relative percent error ( ):
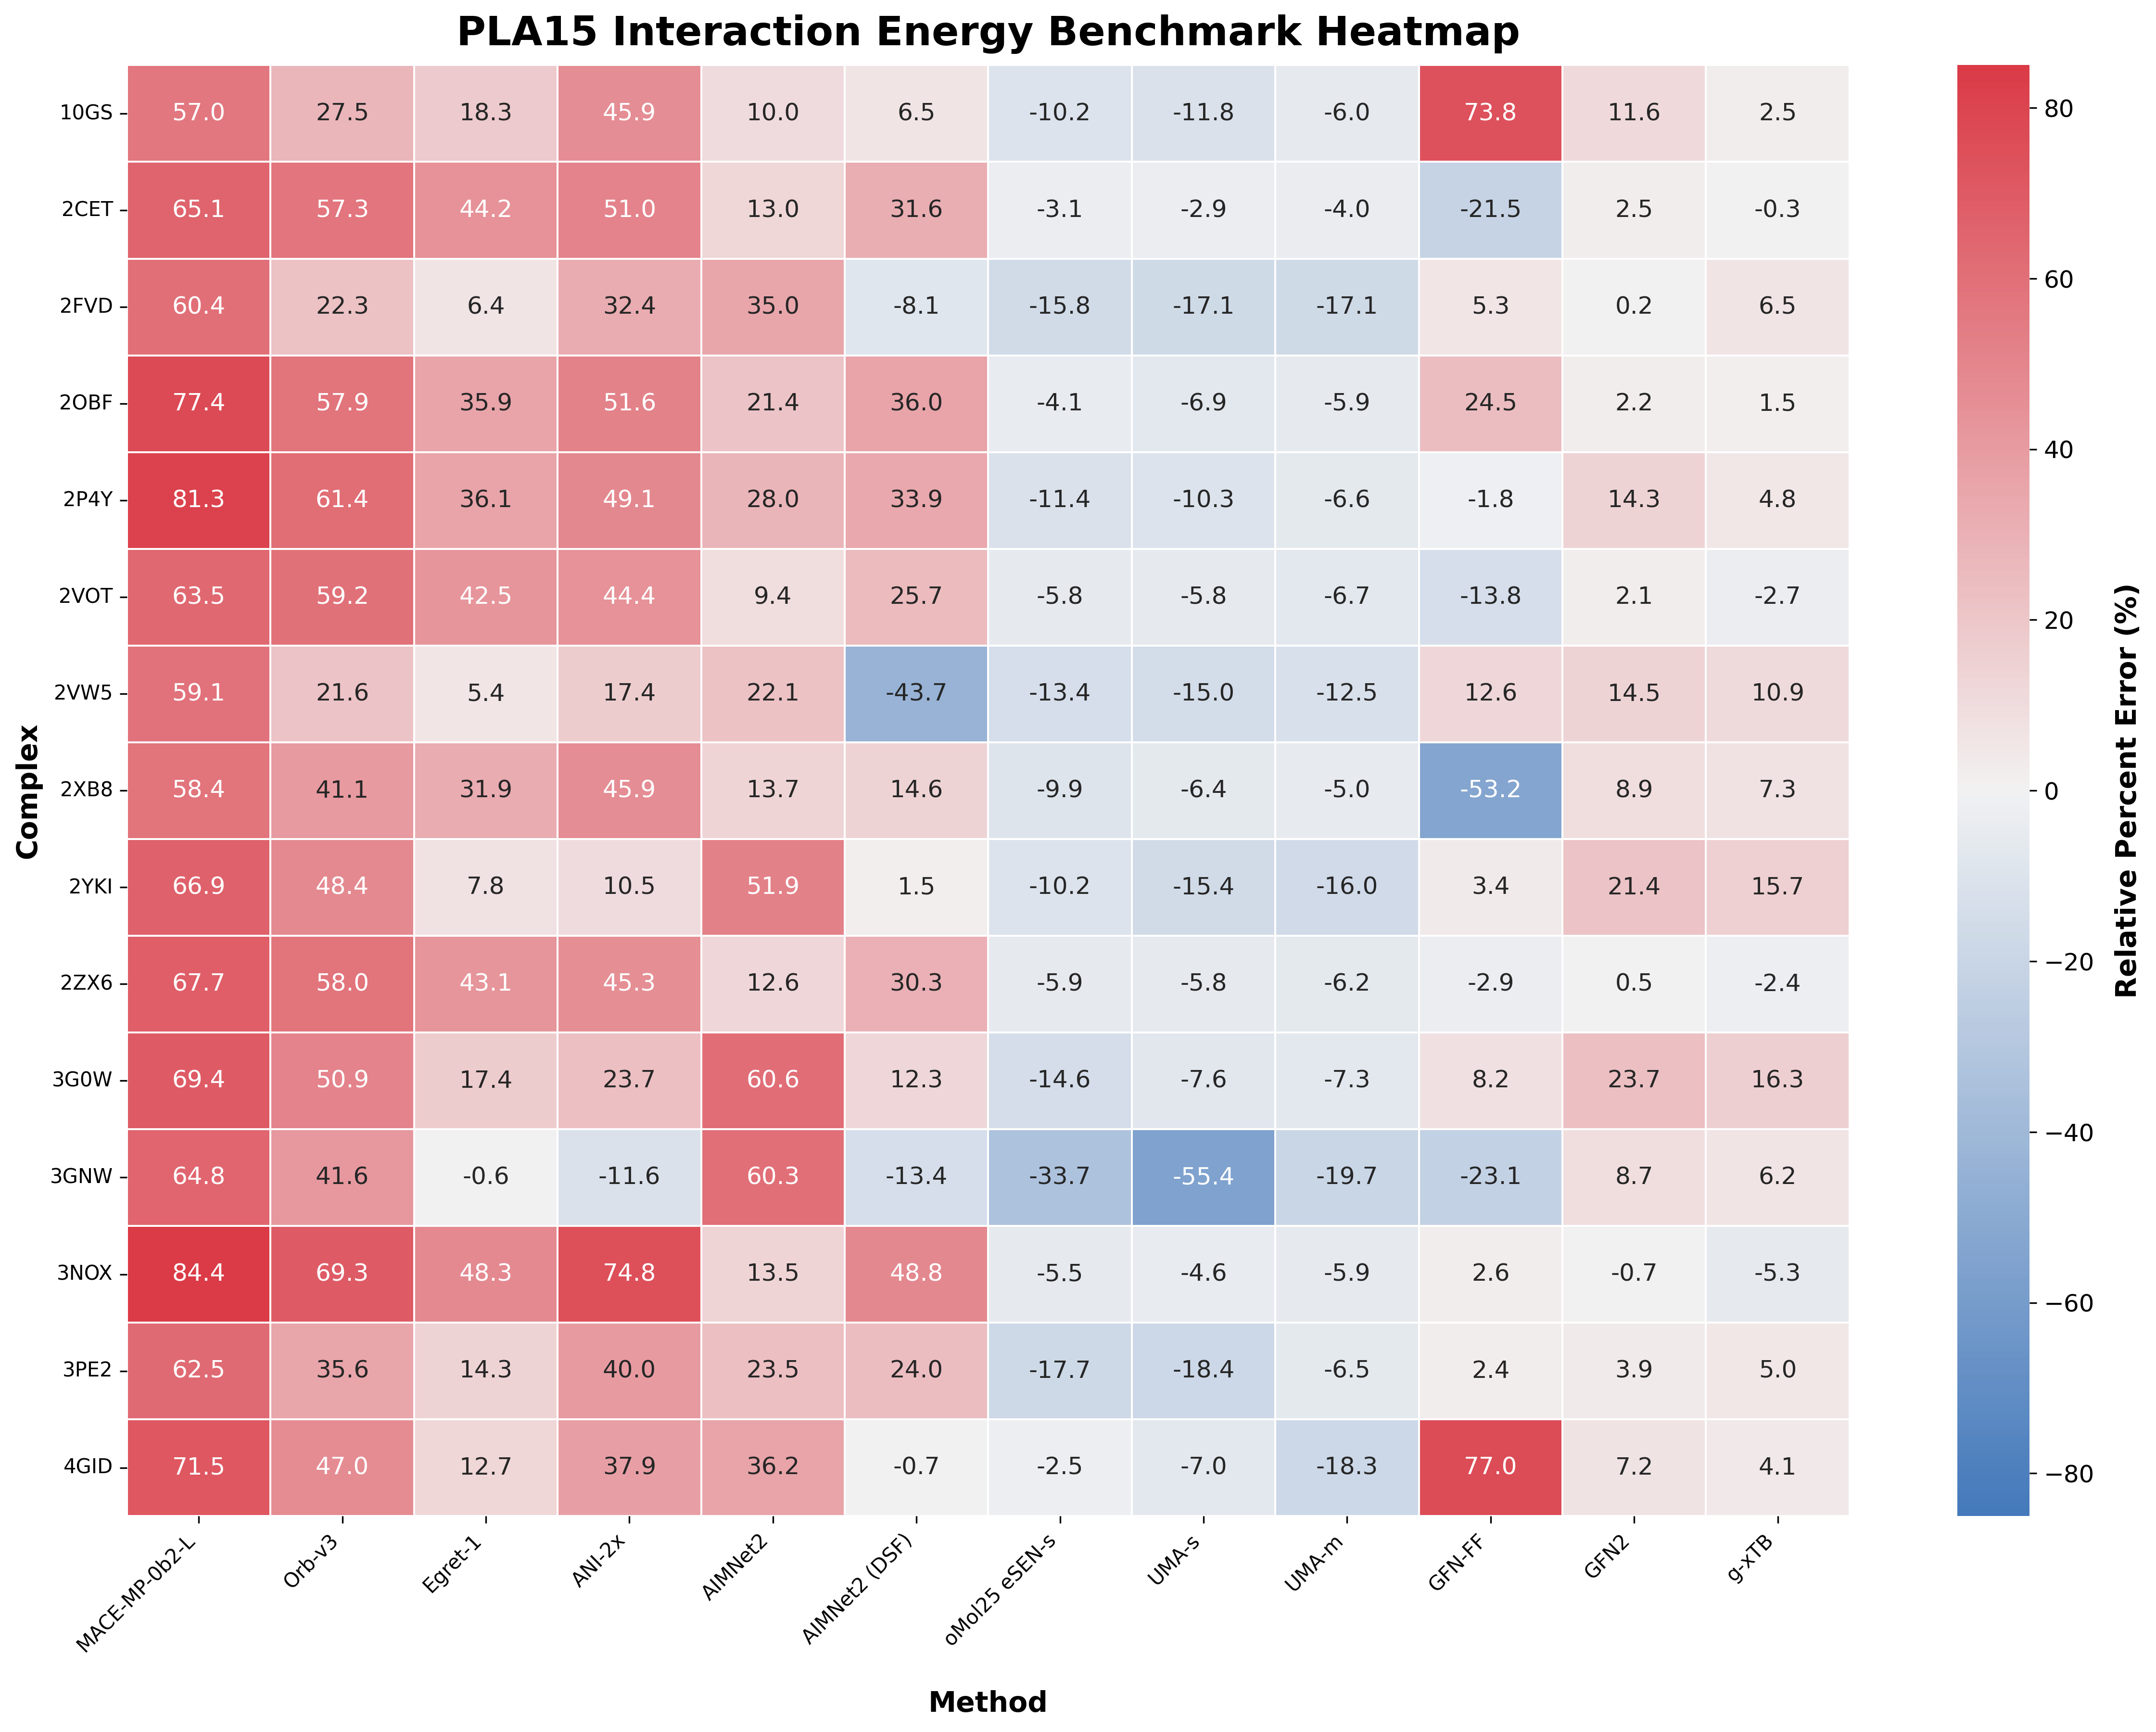
Comparison of a variety of low-cost methods on the individual complexes in the PLA15 benchmark. (Open image in new tab to view in higher resolution.)
There's a lot to digest—here's a few things that immediately pop out:
- Among the NNPs, the models trained on OMol25 are by far the best. Egret-1 and AIMNet2 (both with naïve and DSF charge handling) are "middle of the road," while the materials-science models (Orb-v3 and MACE-MP-0b2-L) perform worst.
- g-xTB appears to be the best method overall, but GFN2 also looks good.
- Most of the models appear to generally underbind the ligands and predict interaction energies that are too small. Interestingly, the models trained on OMol25 all consistently overbind. This may stem from the use of the VV10 correction in the training data, which allegedly causes overbinding in non-covalent systems.
- Handling explicit charge differently causes big differences. AIMNet2 consistently underbinds with normal charge handling but switches to occasional overbinding with DSF charge handling.
I was surprised to see how good g-xTB was compared to all of the NNPs, boasting a mean absolute percent error of 6.1% on this set. For comparison, the OMol25-trained models hover around the 11% mark, whereas AIMNet2 and Egret-1 are around 25%. The other NNPs fall well behind.
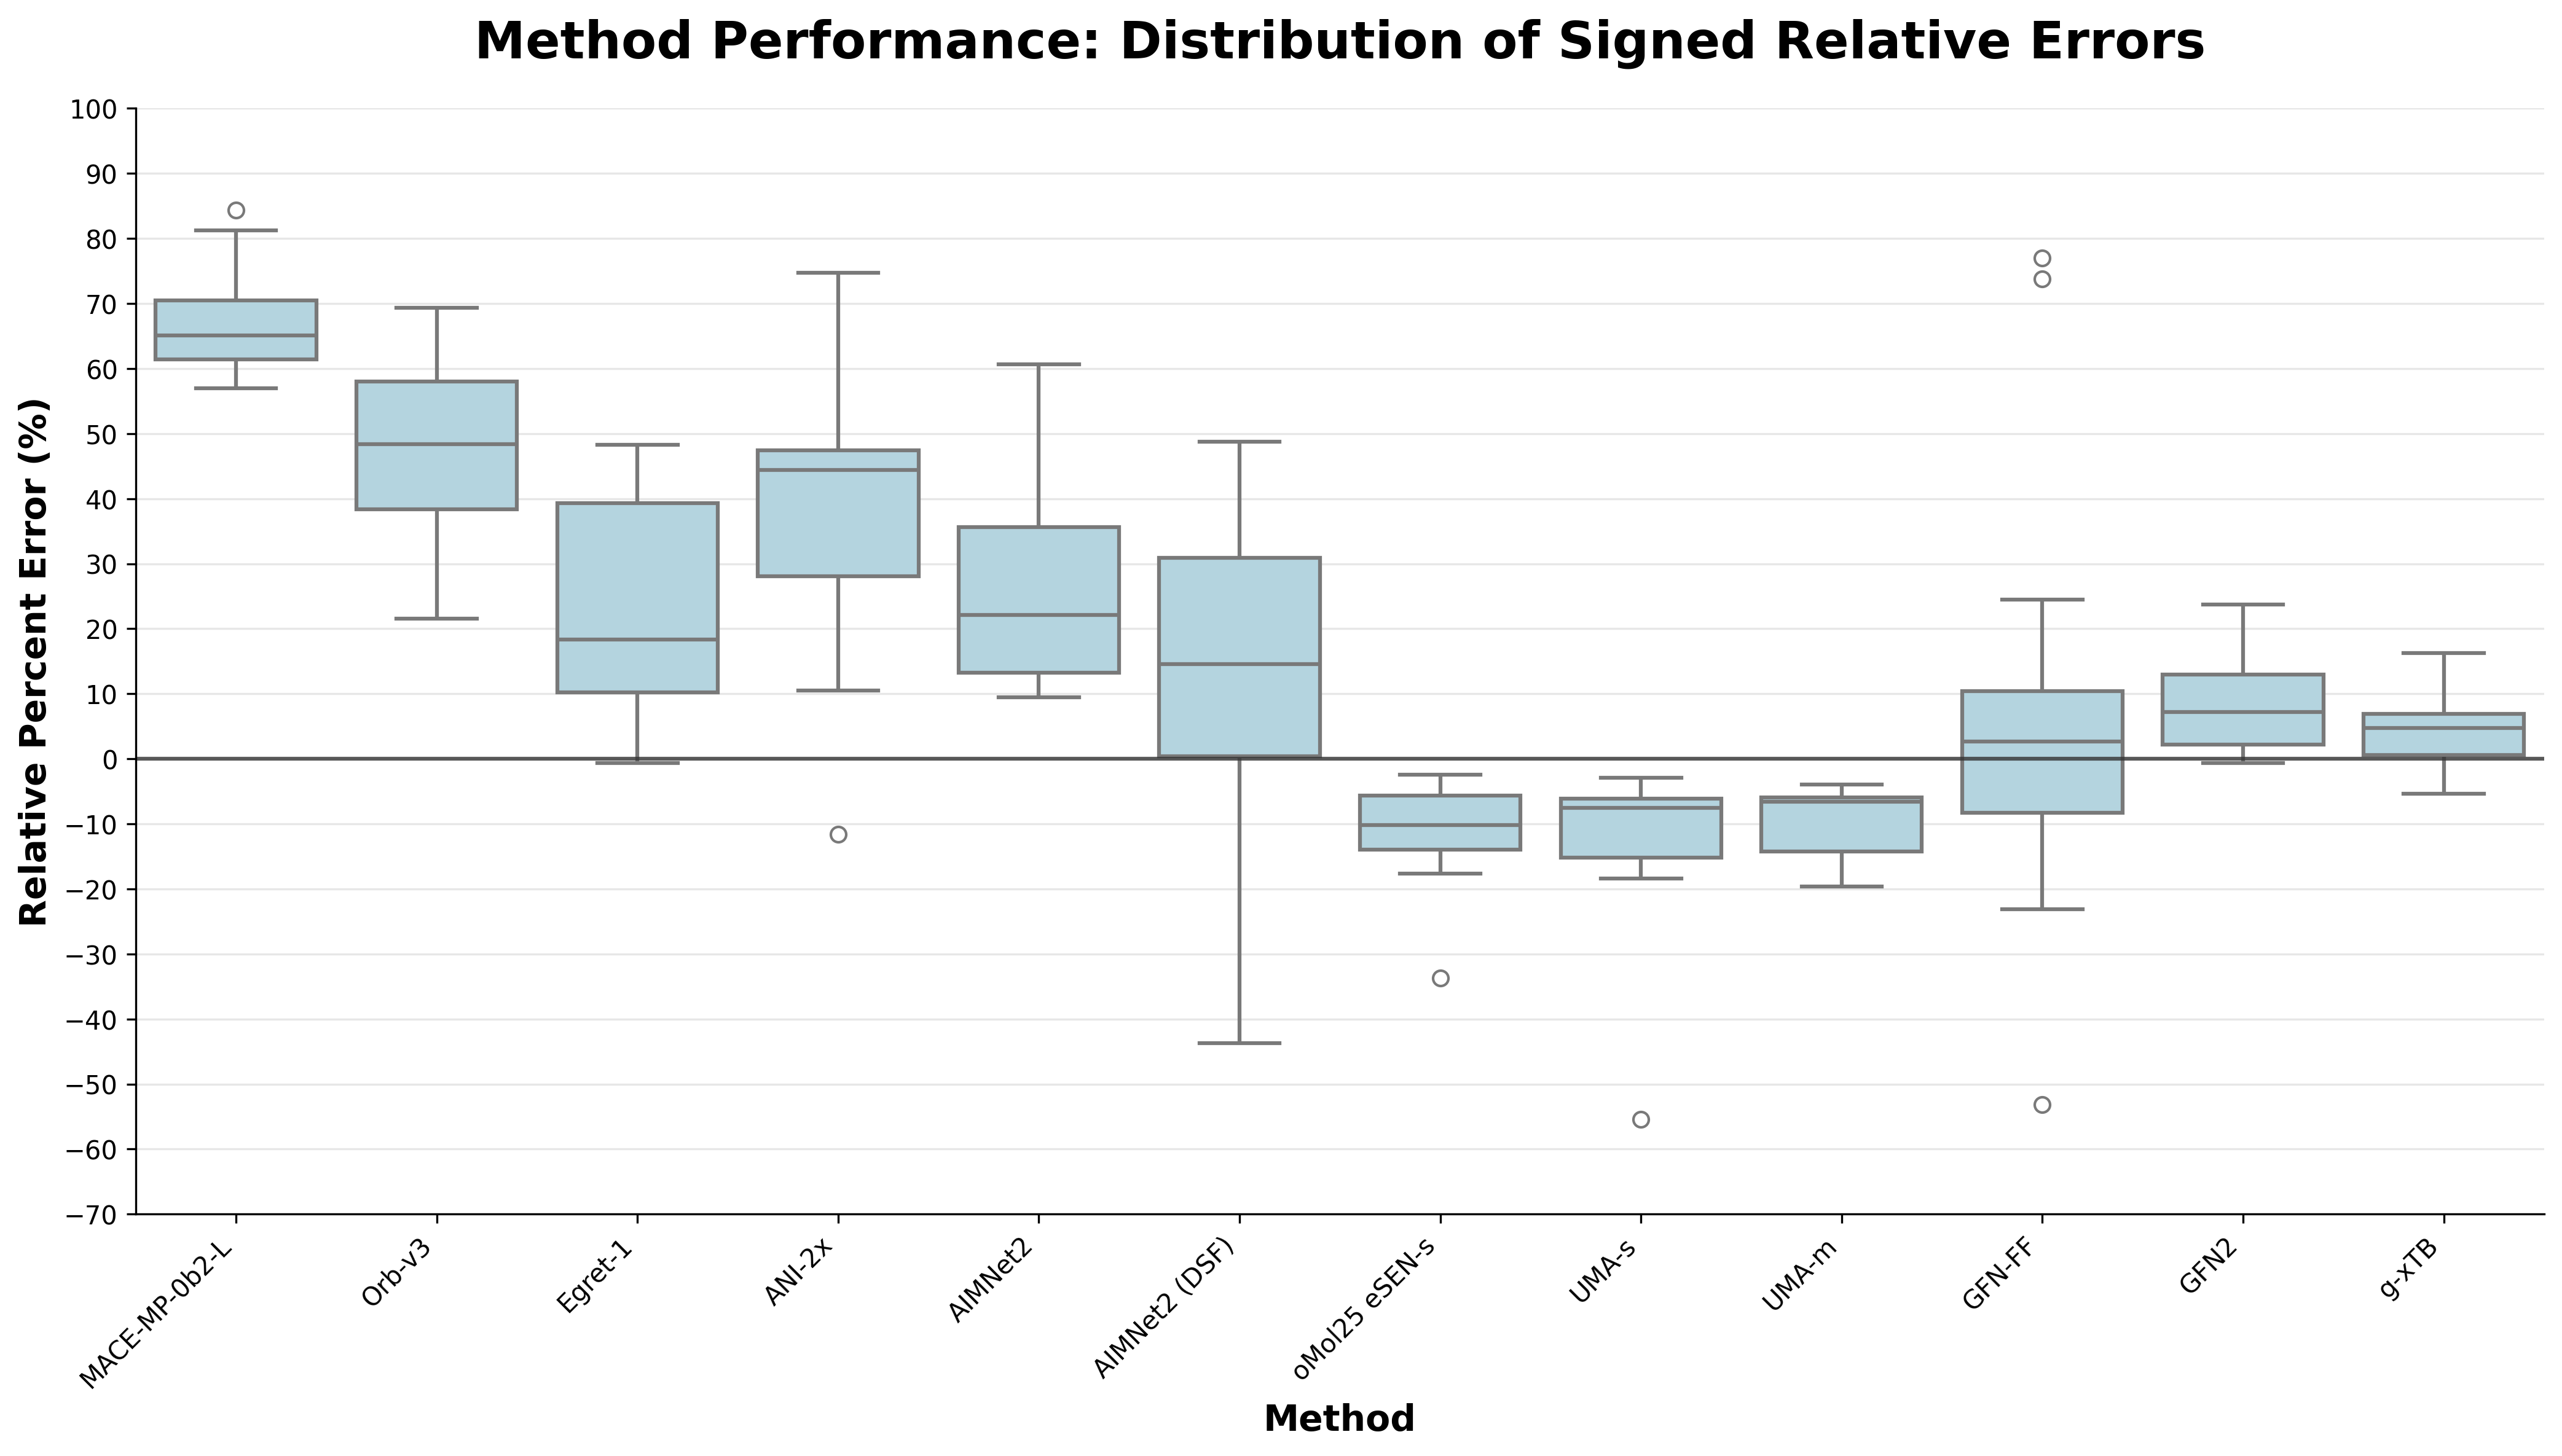
Comparison of the overall performance of different low-cost methods on the PLA15 benchmark. (Open image in new tab to view in higher resolution.)
The spread on g-xTB is also quite nice; no insane outliers are present. Meanwhile, UMA-medium is the only OMol25-based model without any drastic outlier. For any sort of protein–ligand free-energy predictions, having a stable underlying interaction-energy predictor is a must, suggesting that the current generation of NNPs is likely to do poorly at this task. It may be possible to correct the predictions of models that exhibit a strong systematic error like UMA-medium, potentially via Δ-learning the difference.
We also analyzed the Pearson and Spearman correlations of the models under study, to see if the relative rankings were correct.
| Model | Coefficient of Determination () | Spearman | Mean Abs. Percent Error (%) |
|---|---|---|---|
| MACE-MP-0b2-L | 0.611 ± 0.171 | 0.750 ± 0.159 | 67.29 |
| Orb-v3 | 0.565 ± 0.137 | 0.776 ± 0.141 | 46.62 |
| Egret-1 | 0.731 ± 0.107 | 0.876 ± 0.110 | 24.33 |
| ANI-2x | 0.543 ± 0.251 | 0.613 ± 0.232 | 38.76 |
| AIMNet2 | 0.969 ± 0.020 | 0.951 ± 0.050 | 27.42 |
| AIMNet2 (DSF) | 0.633 ± 0.137 | 0.768 ± 0.155 | 22.05 |
| oMol25 eSEN-s | 0.992 ± 0.003 | 0.949 ± 0.046 | 10.91 |
| UMA-s | 0.983 ± 0.009 | 0.950 ± 0.051 | 12.70 |
| UMA-m | 0.991 ± 0.007 | 0.981 ± 0.023 | 9.57 |
| GFN-FF | 0.446 ± 0.225 | 0.532 ± 0.241 | 21.74 |
| GFN2 | 0.985 ± 0.007 | 0.963 ± 0.036 | 8.15 |
| g-xTB | 0.994 ± 0.002 | 0.981 ± 0.023 | 6.09 |
The corresponding and Spearman coefficients largely seem to match what is seen in the previous two figures. The exception is AIMNet2, which seems to rank-order and correlate very strongly with the reference data even while having a high average relative error. This either implies that AIMNet2's outputs are off by roughly a linear offset (which would be great!), or this is just "lucky" and can be attributed to the small size of the dataset. I'm inclined to say it's the latter, but I remain hopeful. It's worth noting that Egret-1, which has similar relative errors to AIMNet2, does far worse here.
In accordance with chemical intuition, charge handling seems to matter a lot here: the worst NNPs are those that don't explicitly take a total molecular charge as input. Every complex in the PLA15 dataset contained either a charged ligand or a charged protein; future work in NNP development should focus on better accounting for the effect of charge across large systems, as it seems to be crucial here.
Note: Olexandr Isayev responded on X, saying:
Due to incorrect electrostatics the public aimnet2 models should not be used for protein-ligand systems. The interaction energy is wrong!
This may explain why AIMNet2, the only model which explicitly includes charge-based energy terms, doesn't seem to perform any better here.
To summarize, the PLA15 benchmark shows that there's a pretty stark gap between today's NNPs and semiempirical methods for predicting protein–ligand interaction energies. Though models like UMA-medium show promise, their consistent overbinding suggests a need for a systematic correction. Other models simply have absolute errors that are too large to deem them reliable.
Right now, g-xTB seems to be the clear winner in terms of accuracy. While it can't take advantage of the growing power of GPUs, it's still incredibly fast. We remain hopeful that future generations of NNPs will address the problems discussed here and provide computational chemists with fast, accurate, and reliable methods for computing protein–ligand interaction energies.
Methodology
The PLA15 dataset comes with 15 PDB files and a plain text file with reference energies. All NNP interaction energies were calculated by masking out the protein/ligand from the PDB based on residue name as needed, and then using the ASE calculator interface. For the tight-binding methods, I converted each PDB into 3 .xyz files (complex, protein, ligand) and ran jobs through Rowan's Python API. Formal charge information is at the top of the supplied PDBs and was passed explicitly where required. All input files and output energies can be found at this GitHub repo.